Trophic cascades
We now understand consumer–resource dynamics through the lens of a simple model:
\[\frac{dR}{dt} = rR - aRC\]
\[\frac{dC}{dt} = eaRC - mC\]
- An increase in consumer is detrimental to the resource
- An increase in resource is beneficial for the consumer
Most ecological communities have multiple trophic levels
(e.g. plant, herbivore, carnivore)
- How might we model these?
Let’s consider a model with a Resource (\(R\)), “first level Consumer” (\(C_1\)), and “second level Consumer (\(C_2\)):
\[\frac{dR}{dt} = rR - aRC_1\]
\[\frac{dC_1}{dt} = e_1a_1RC_1 - m_1C_1 - e_2C_1C_2\] . . .
\[\frac{dC_1}{dt} = e_2a_2C_1C_2 - m_2C_2\] ##
(see also: https://www.youtube.com/watch?v=M-oCdHXgzhU&list=RDM-oCdHXgzhU&start_radio=1 )
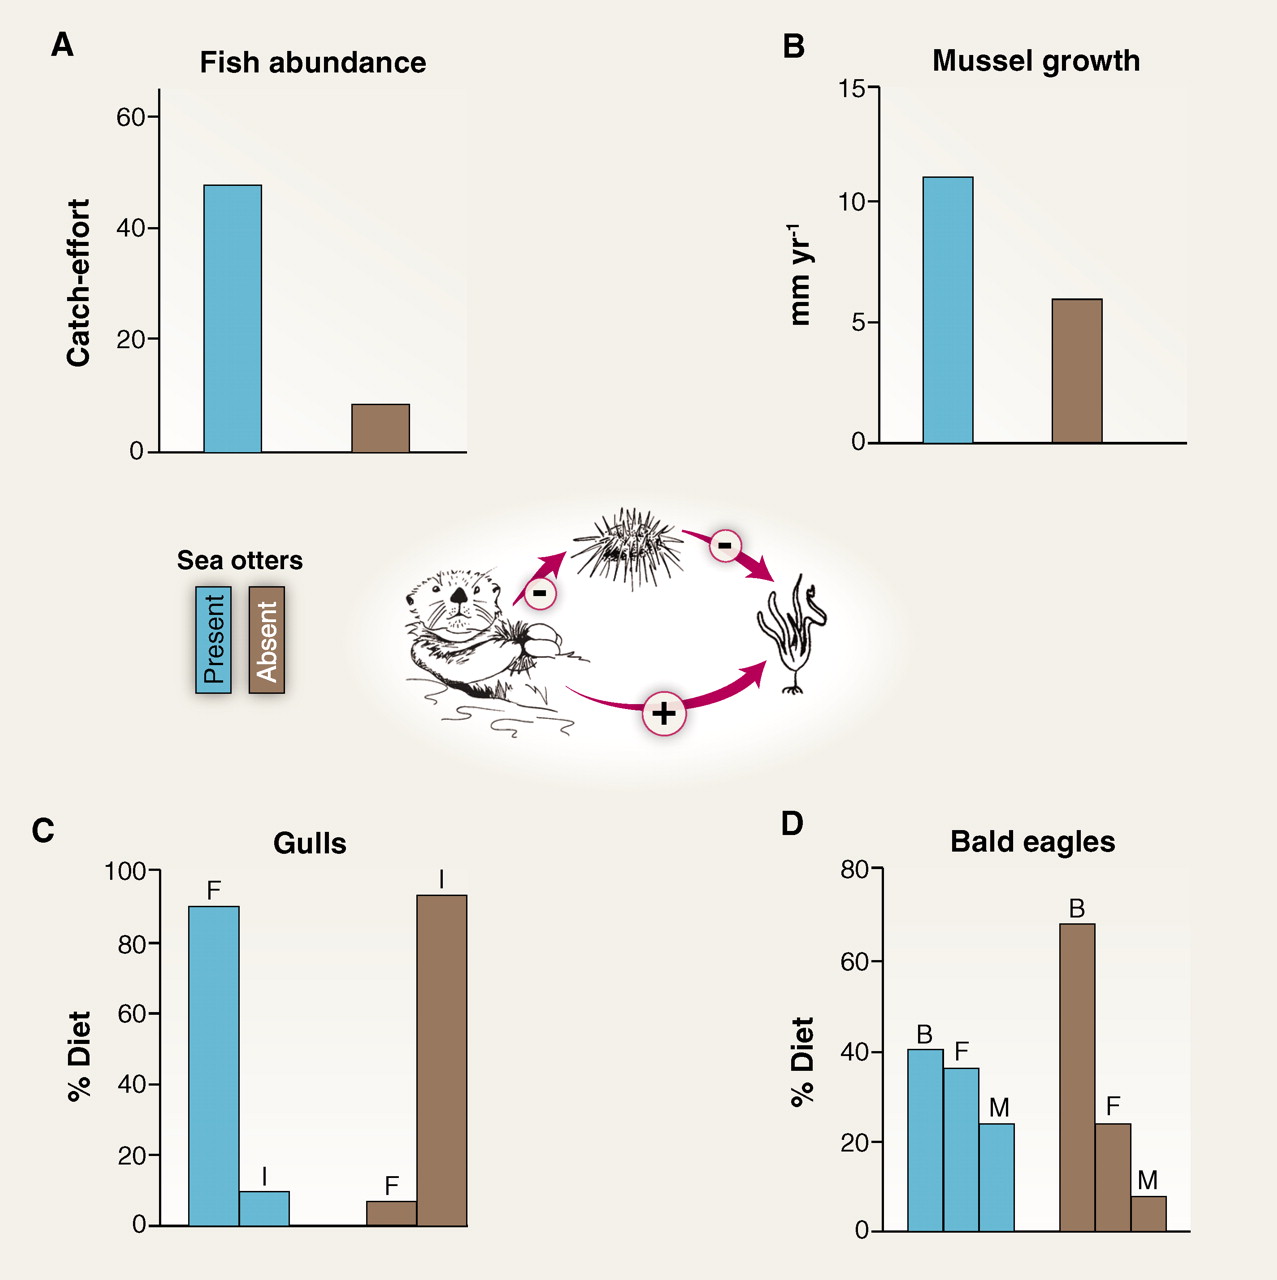
Otters as keystone species
This research, along with others, raised the idea of otters as a “Keystone” species
These are species that are not super-common, but have a disproportionate impact
Predators seem to be common keystone species:
- They regulate other organisms, which regulate other organisms
Keystones in other systems:
https://www.pbs.org/wnet/nature/serengeti-rules-dhbtnm/19906/
(Min 18:34)
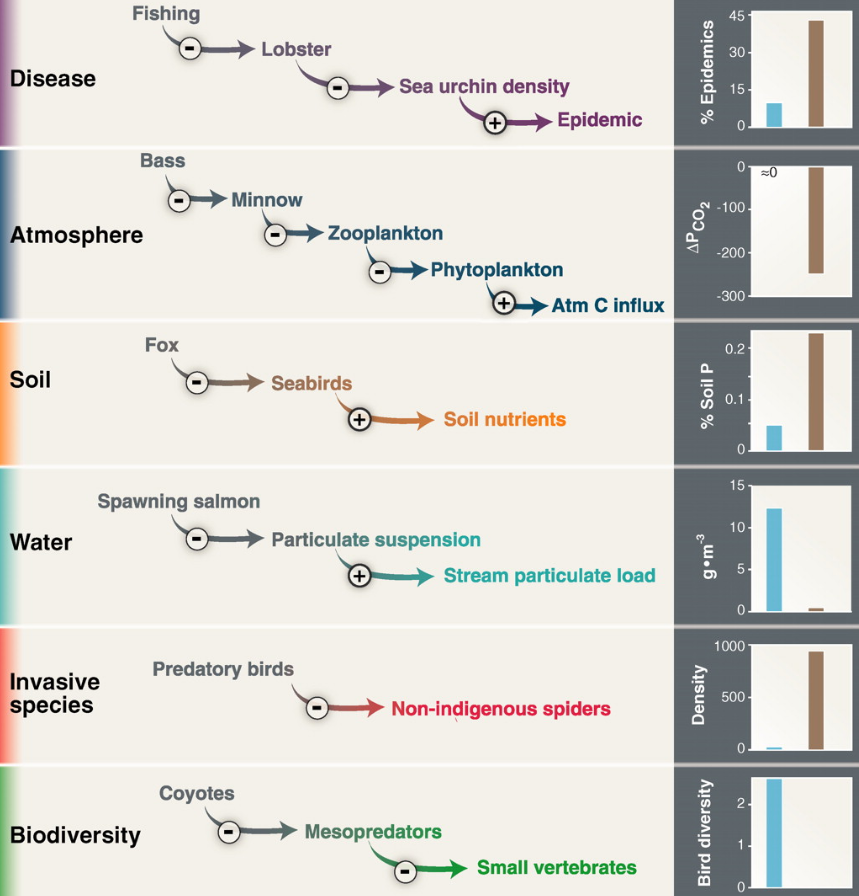
https://www.pbs.org/wnet/nature/serengeti-rules-dhbtnm/19906/
Min 33:15
Synthesis
When we simply observe nature, we can be surprised by seemingly unrelated things being linked to one another
- e.g. What does a virus that affects cattle have to do with the spread of wildfire?
- Or what does the reintroduction of wolves to Yellowstone have to do with hydrology of the rivers in that valley?
But we can make sense of these when we apply a reductionist lens:
- Cattle viruses keep wildebeest in check, as a result of which grasses proliferate, which changes the vegetation structure and alters wildfire spread
On the other hand, a reductionist lens alone might lead us to miss some bigger picture connections