Quantifying biodiversity

In Week 1, we asked a simple question: How many bats live under a bridge in Austin?

We will now ask a second simple question: What is the biodiversity of an ecological community?

  • Case study: birds in Baton Rouge

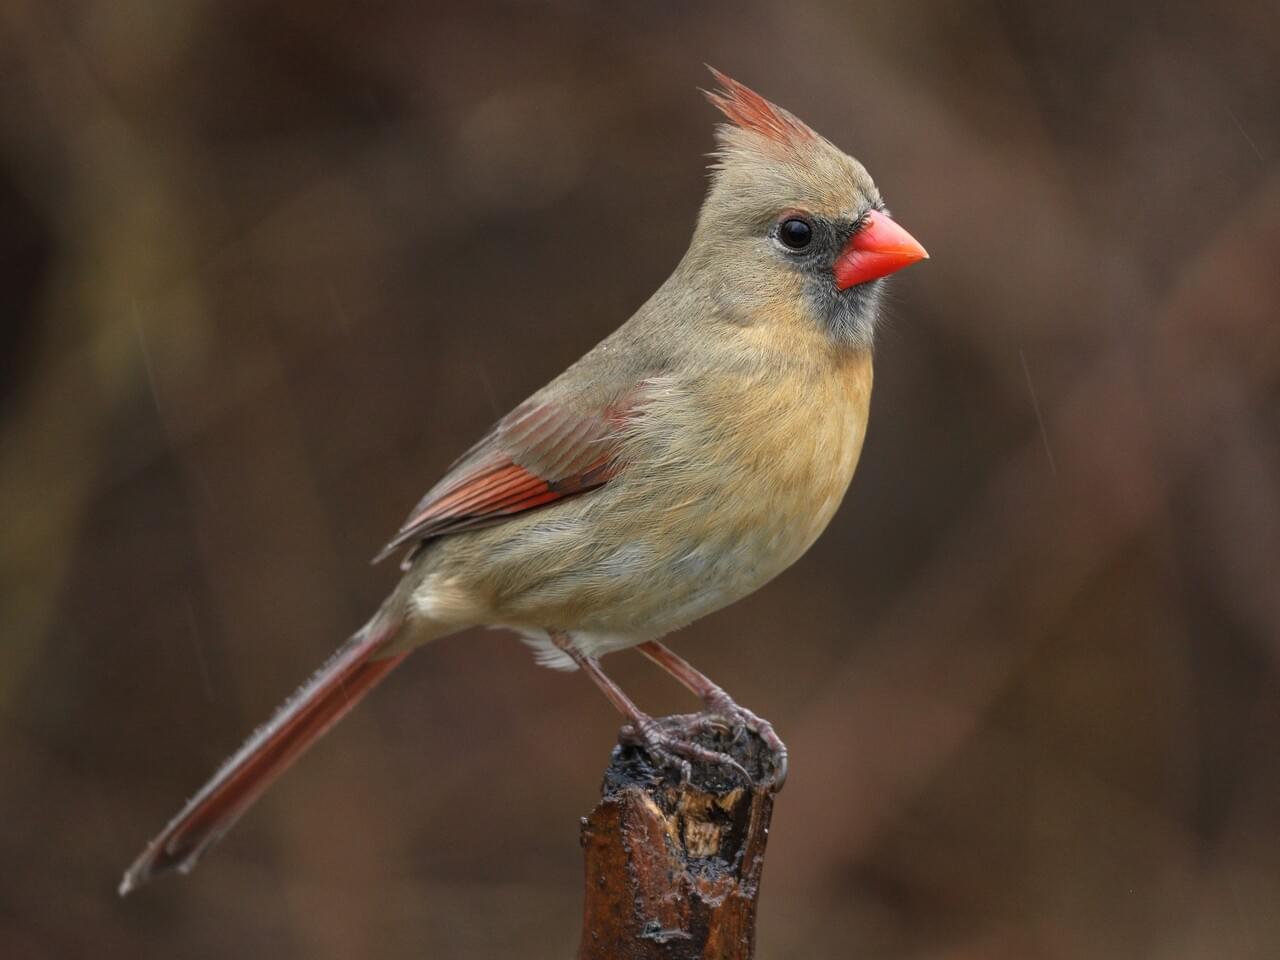
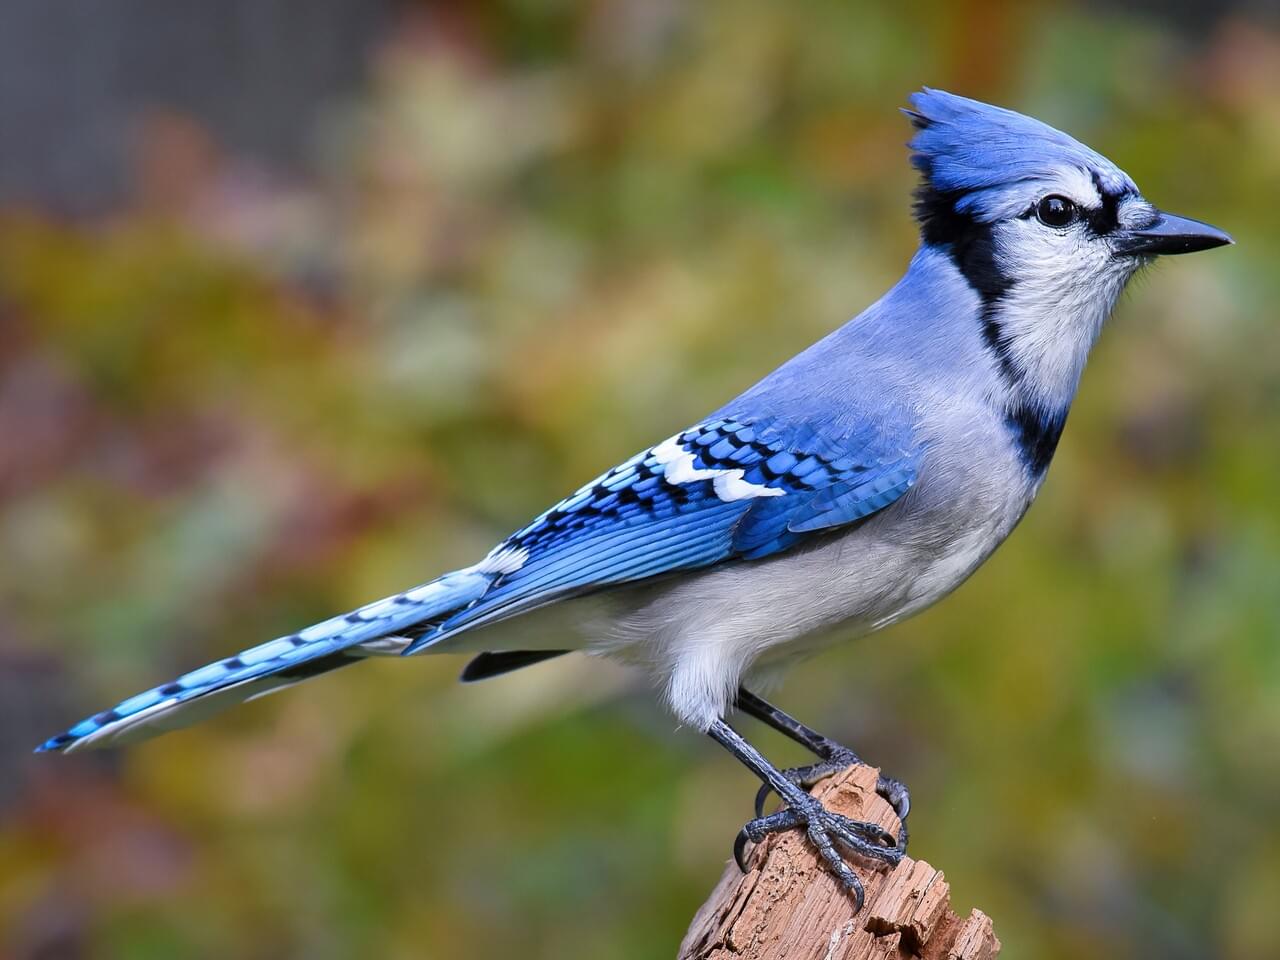
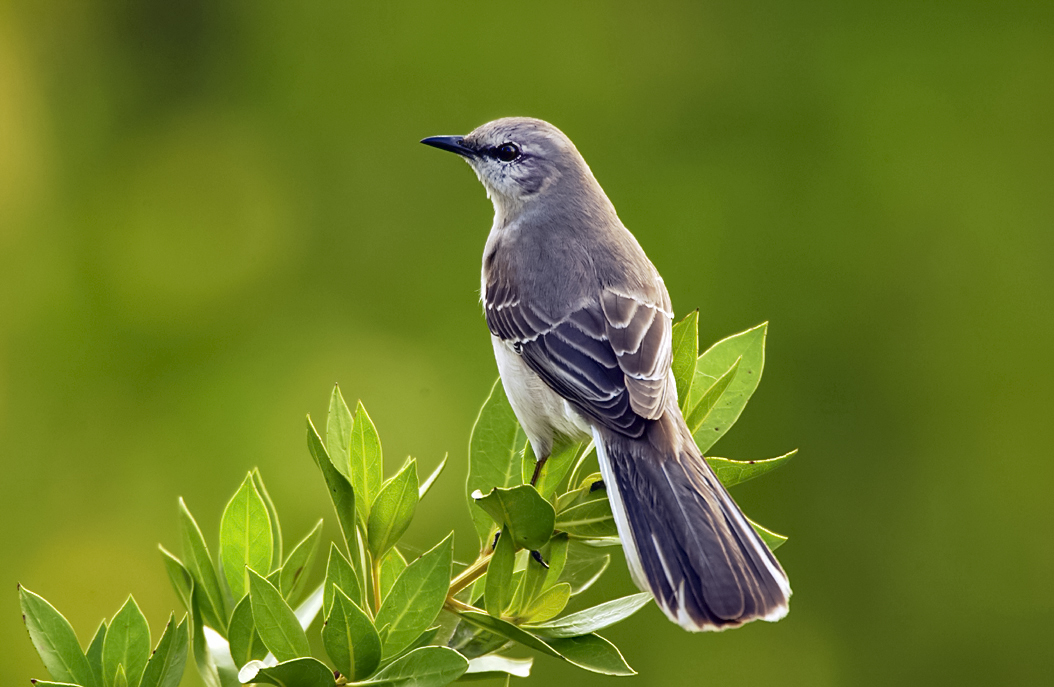
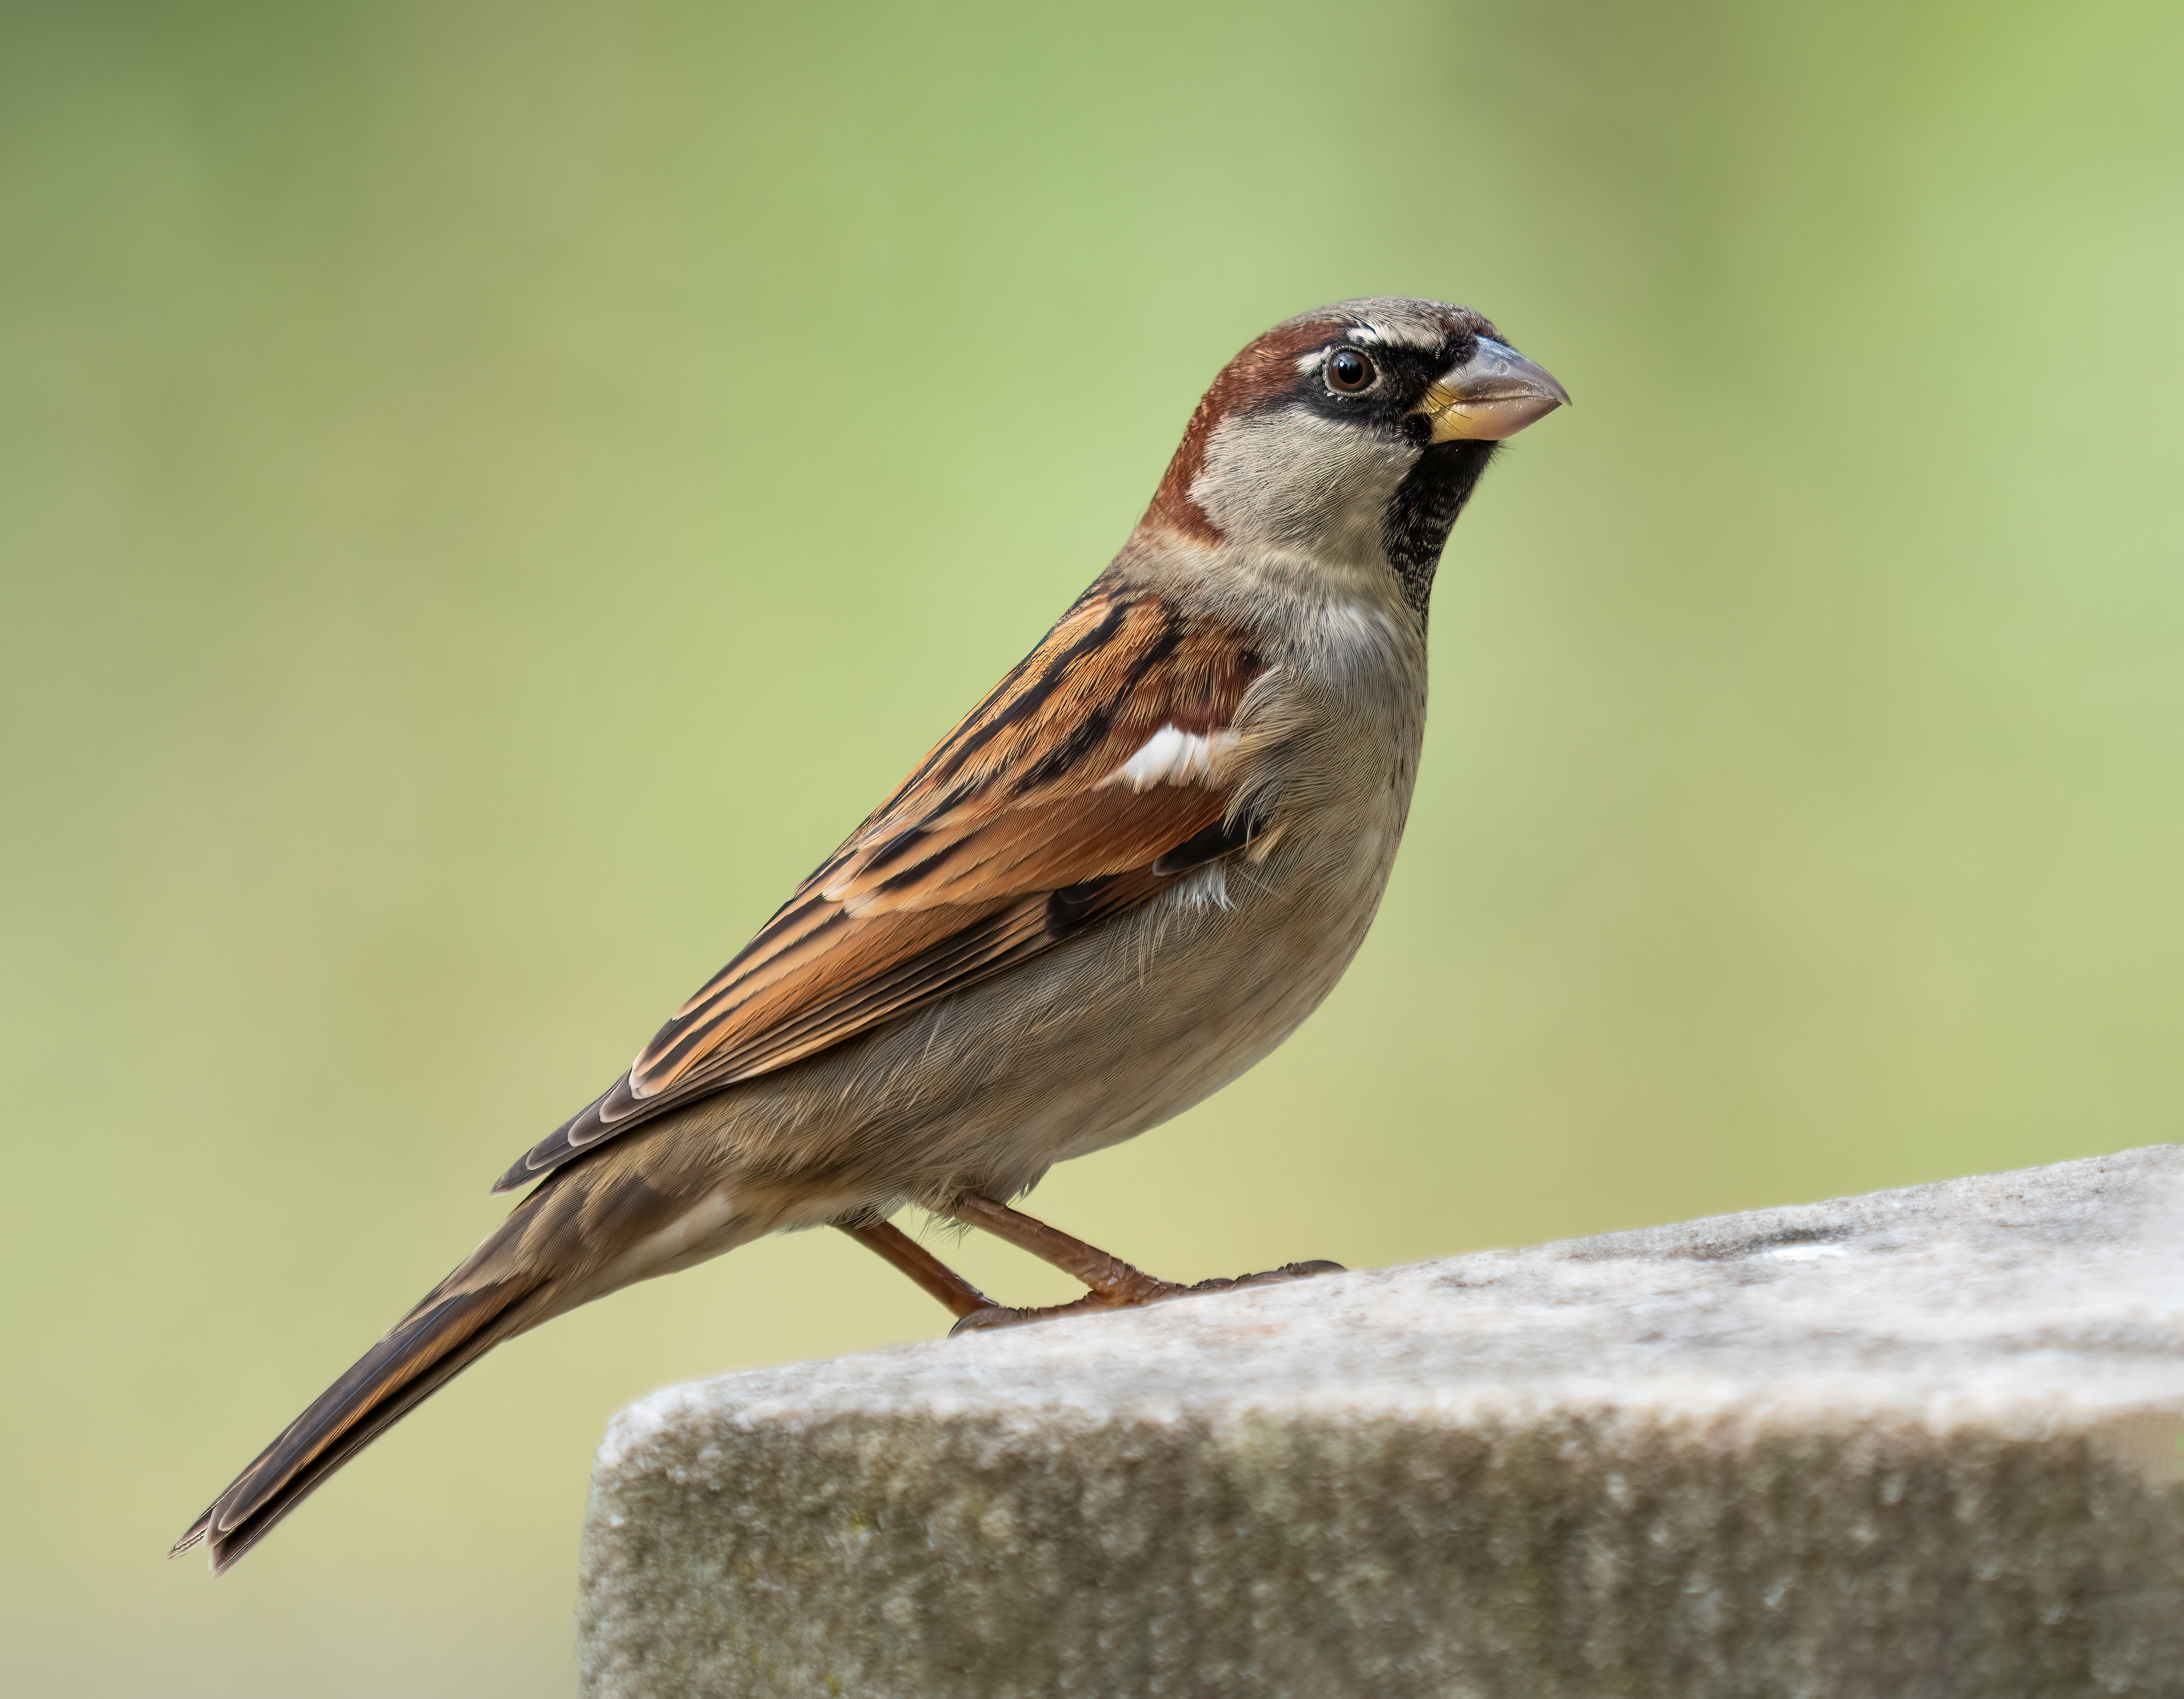
Some common birds of Baton Rouge
Cardinal

Blue Jay

Mockingbird

House sparrow

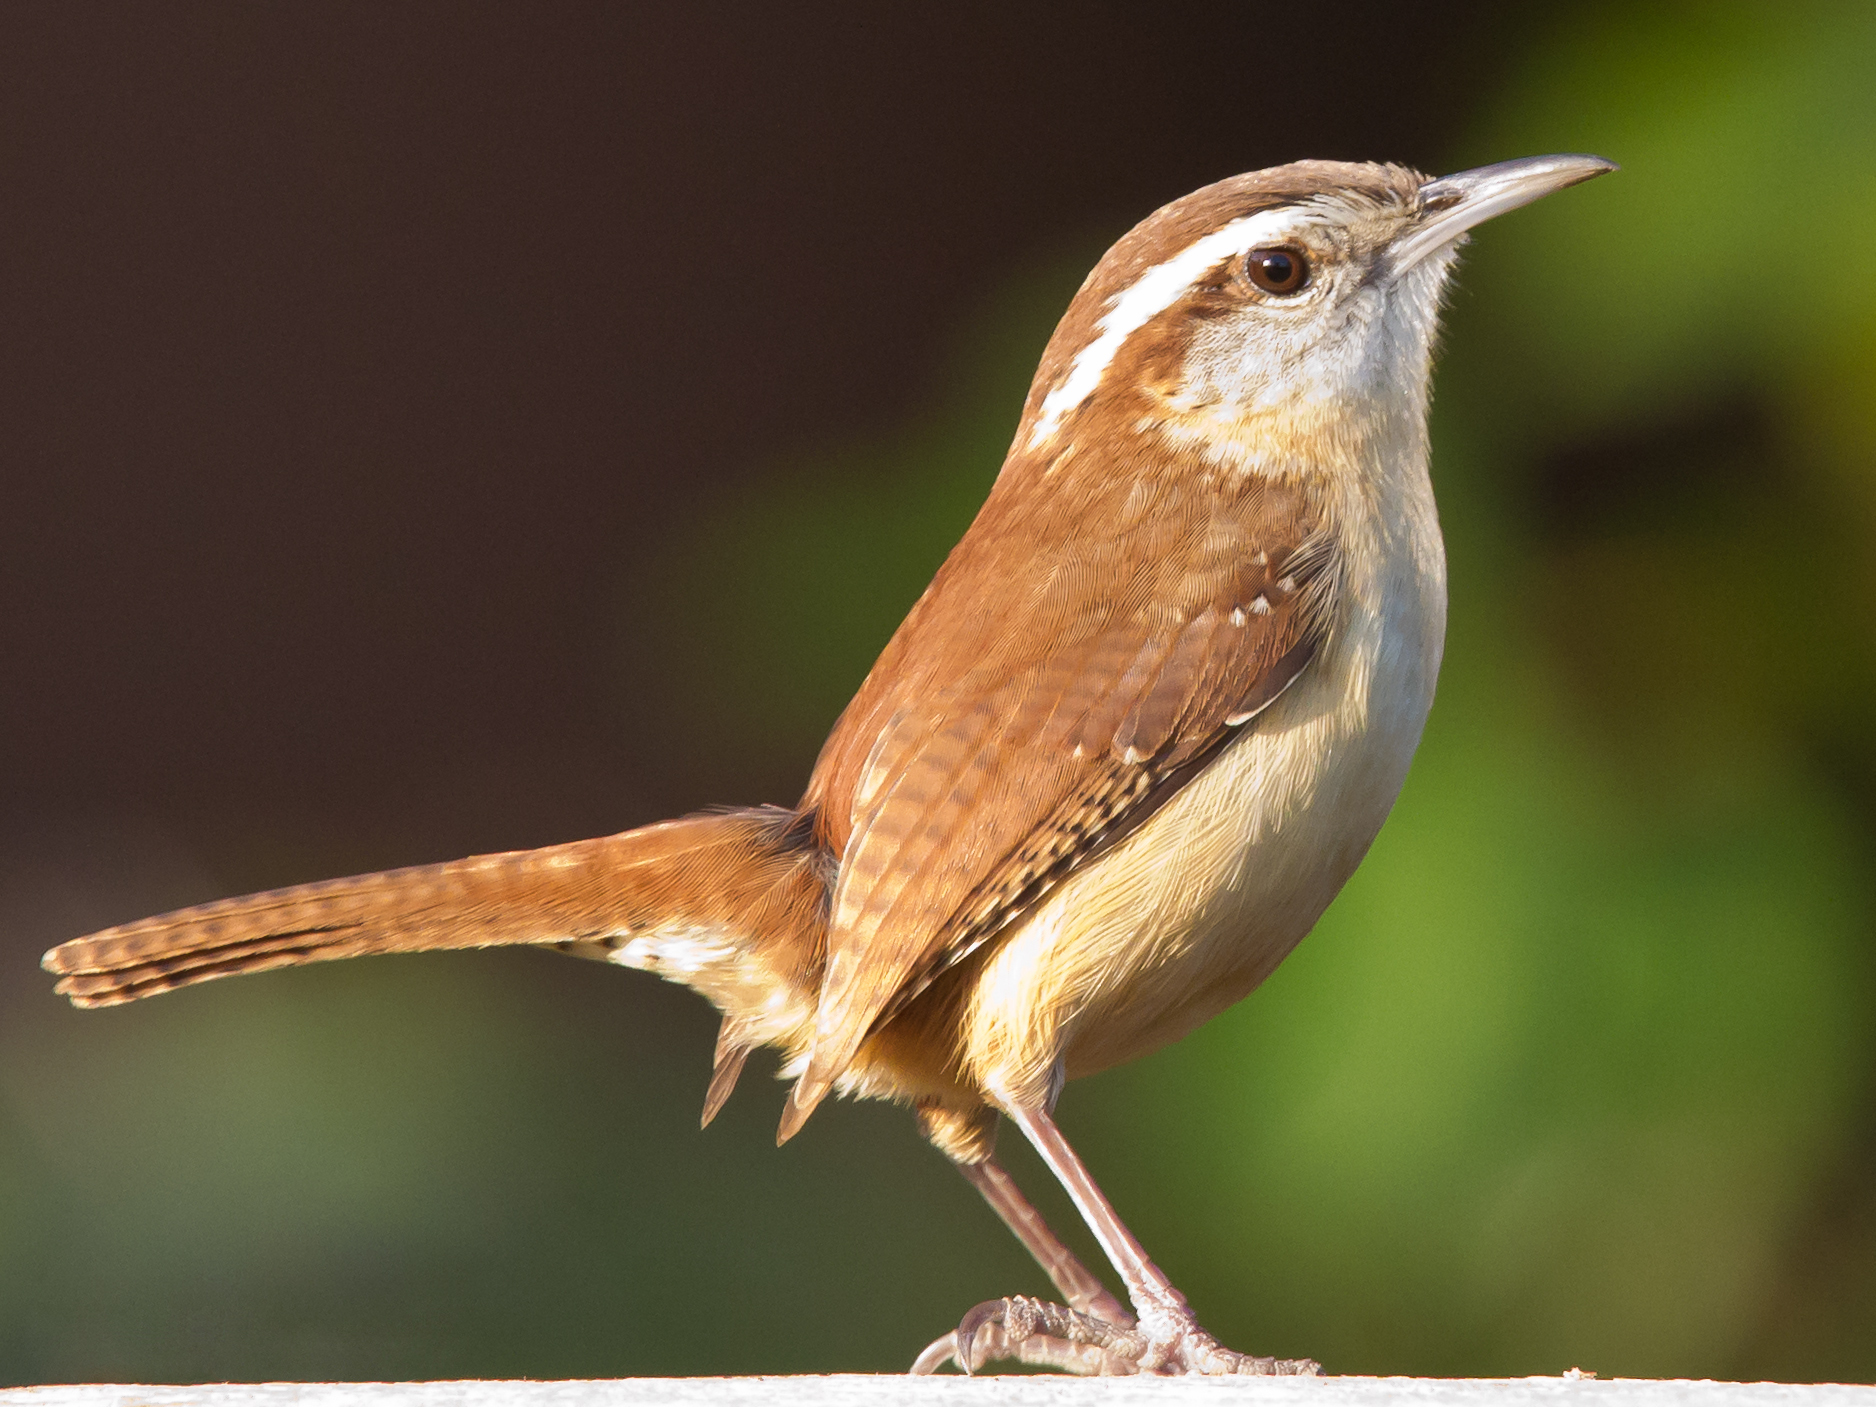
Carolina wren

Carolina chickadee

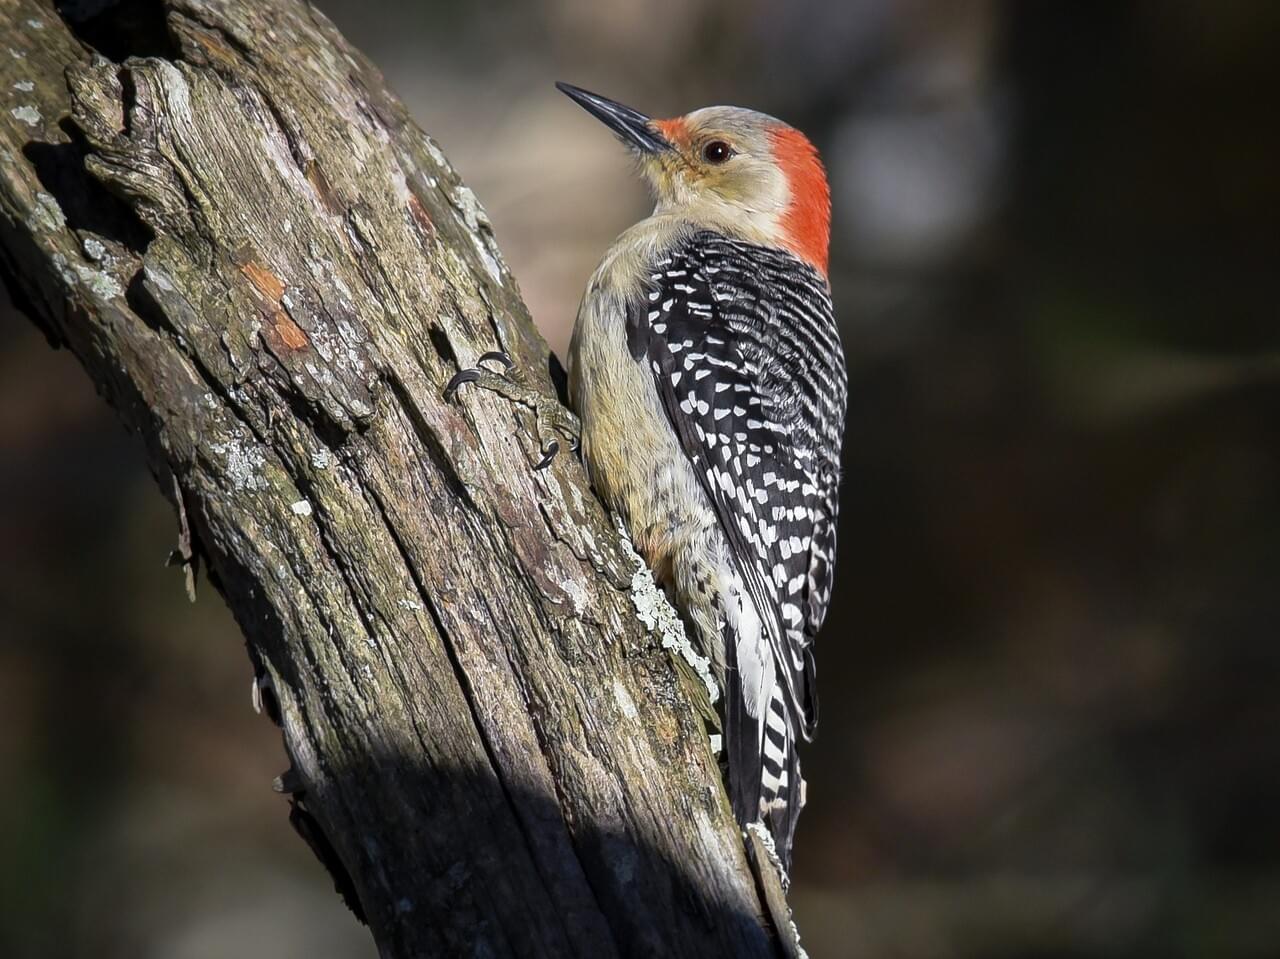
Red-bellied woodpecker

Downy woodpecker

Magnolia warbler

Yellow-rumped warbler

Prothonotory warbler

Red tailed hawk

Consider two communities

Community 1

Red-bellied woodpecker

Downy woodpecker

Pileated woodpecker

Yellow-bellied sapsucker

Community 2

Red-bellied woodpecker

Prothonotory warbler

Red tailed hawk

Carolina chickadee

Consider two other communities

Consider two other communities

How much biodiversity is in each?

Other dimensions of biodiversity
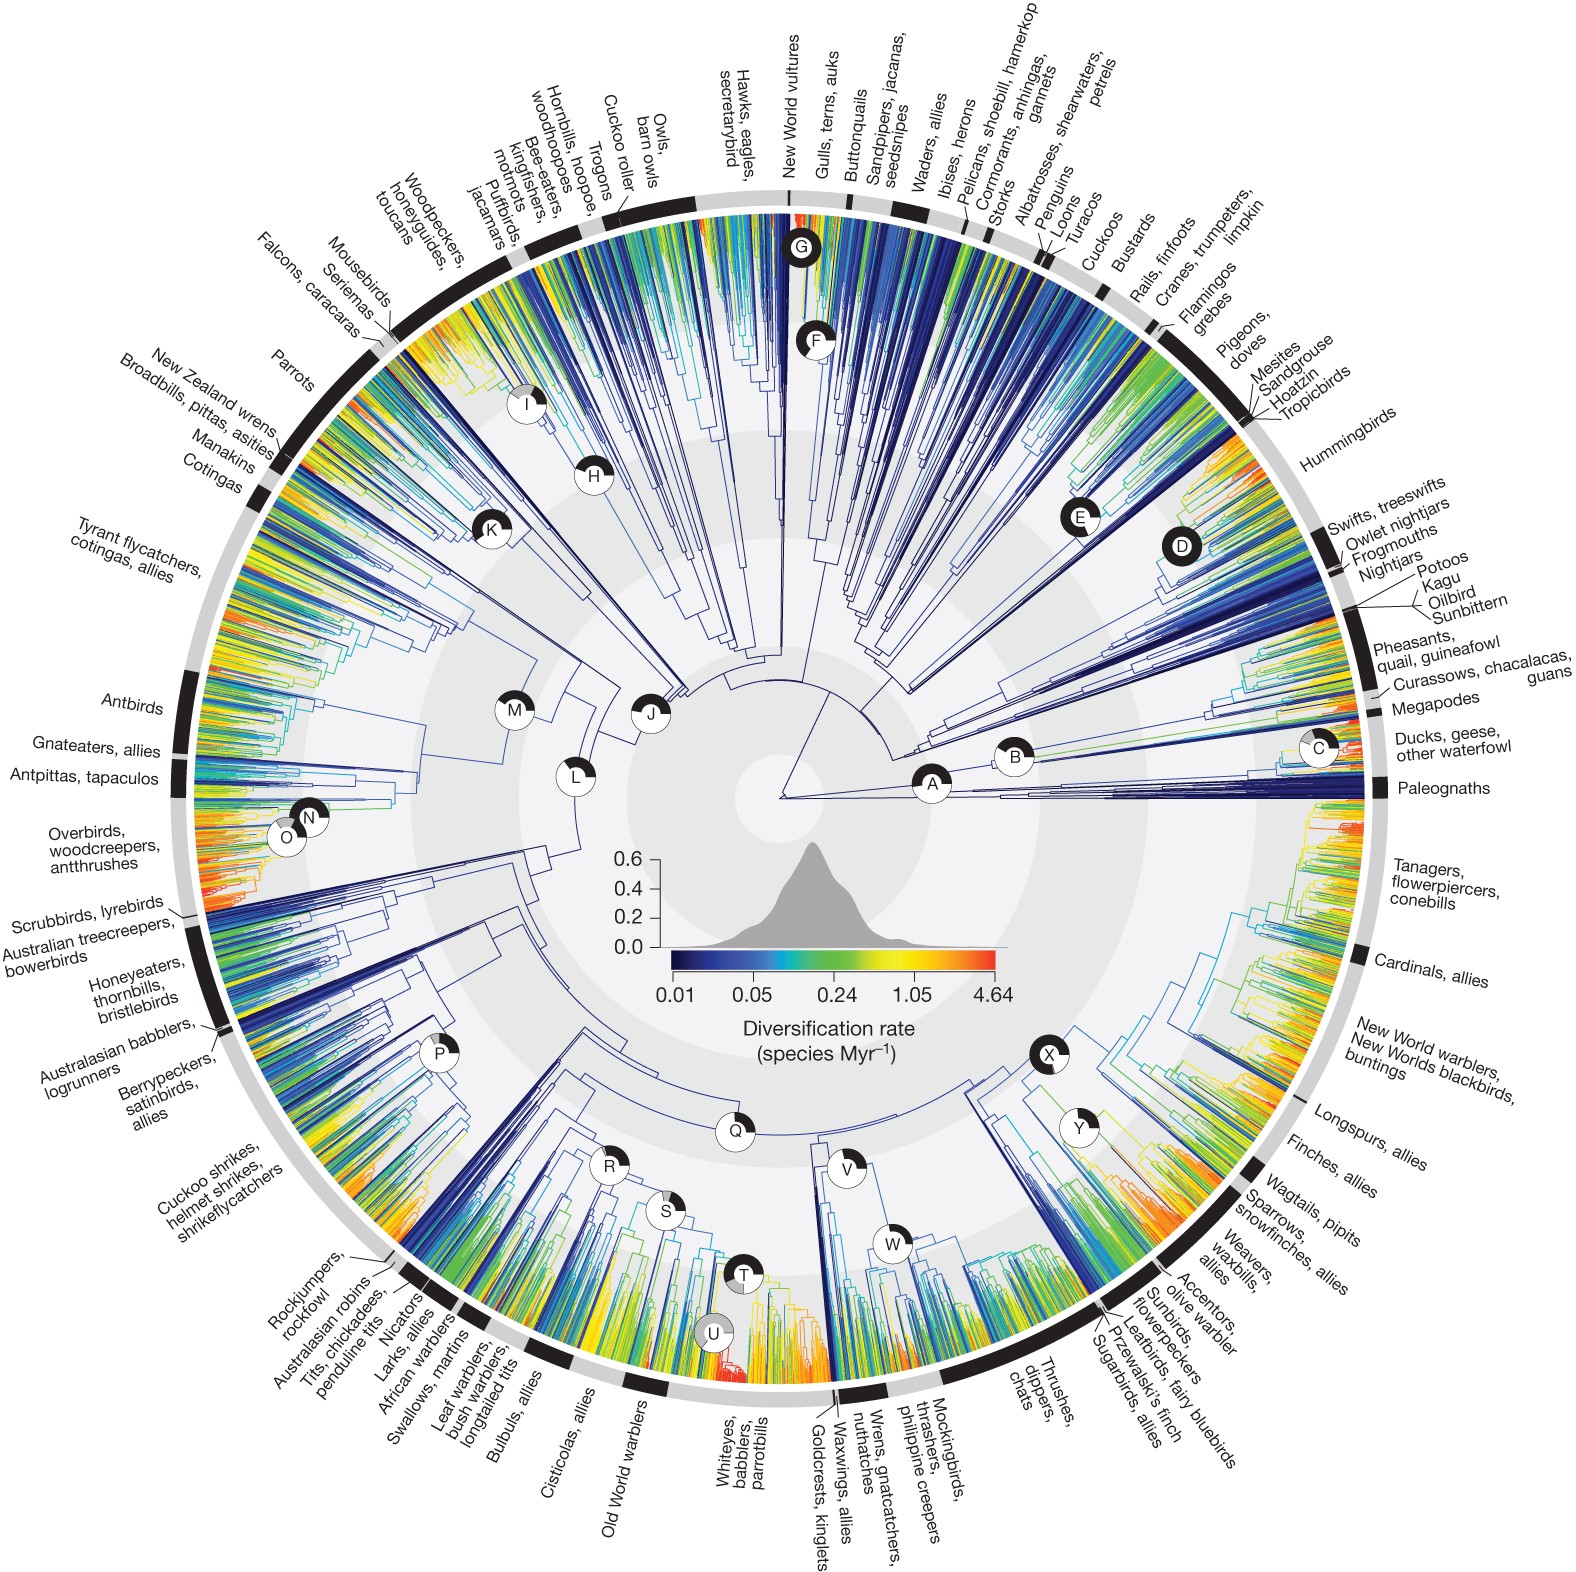
  • Communities can have different amount of “Phylogenetic history” represented in their species list

Other dimensions of biodiversity

Functional variation

  • Instead of thinking about colors or names or evolution, we can consider the “guilds”
  • e.g. “Birds that eat seeds”, “Birds that eat insects”, “Birds that eat other birds”, …

Quantifying biodiversity…

… isn’t so simple either.

  • How to account for variation in abundance?

  • How to acccount for variation in functional differences?

  • How to account for phylogenetic history differences?

We need to use some clever math to help us quantify these patterns!

Accounting for variation in abundance

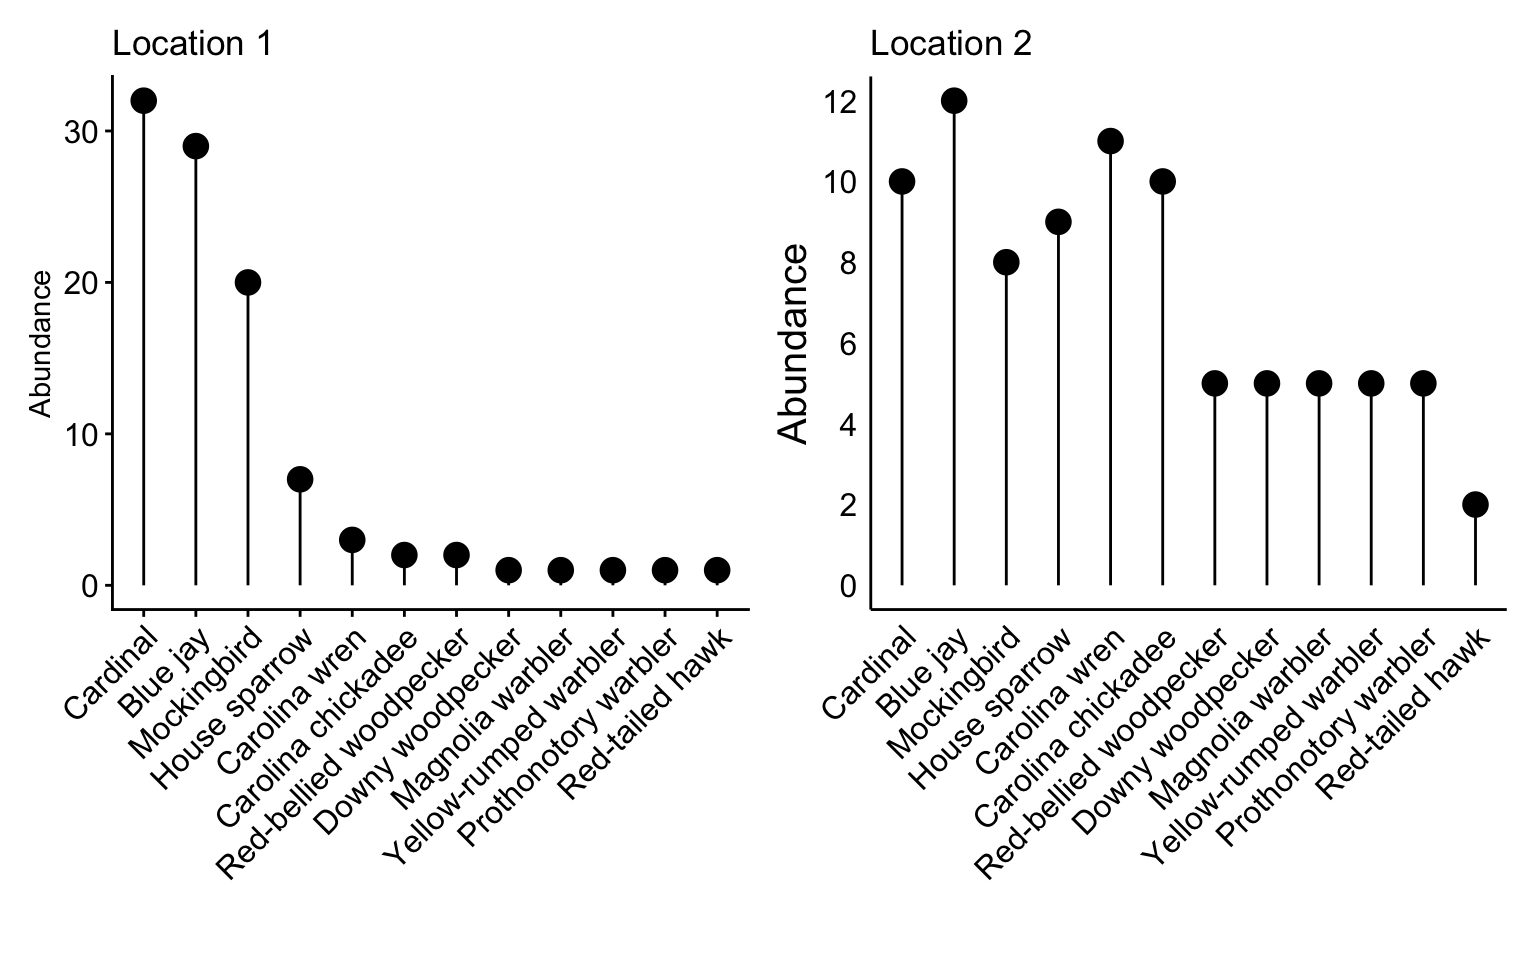
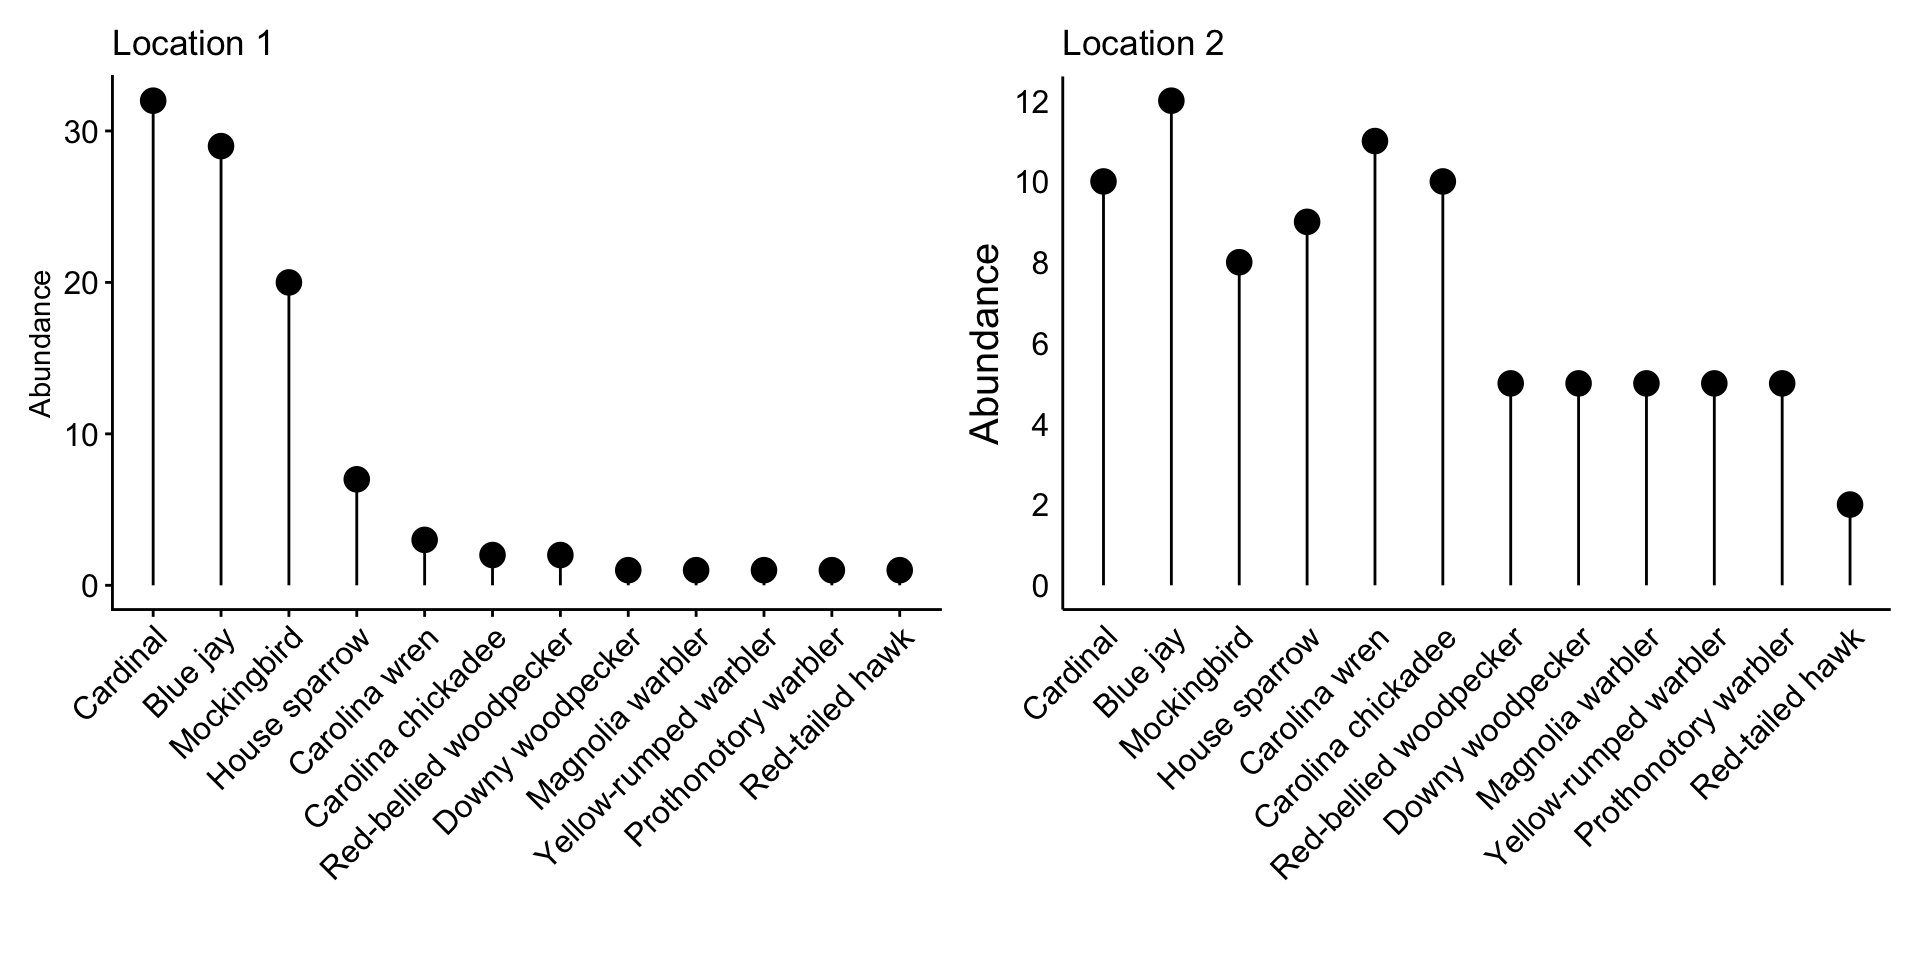
  • If I were randomly finding birds in Location 1 and had to guess which species I would find next, which should I guess?

Shannon diversity index
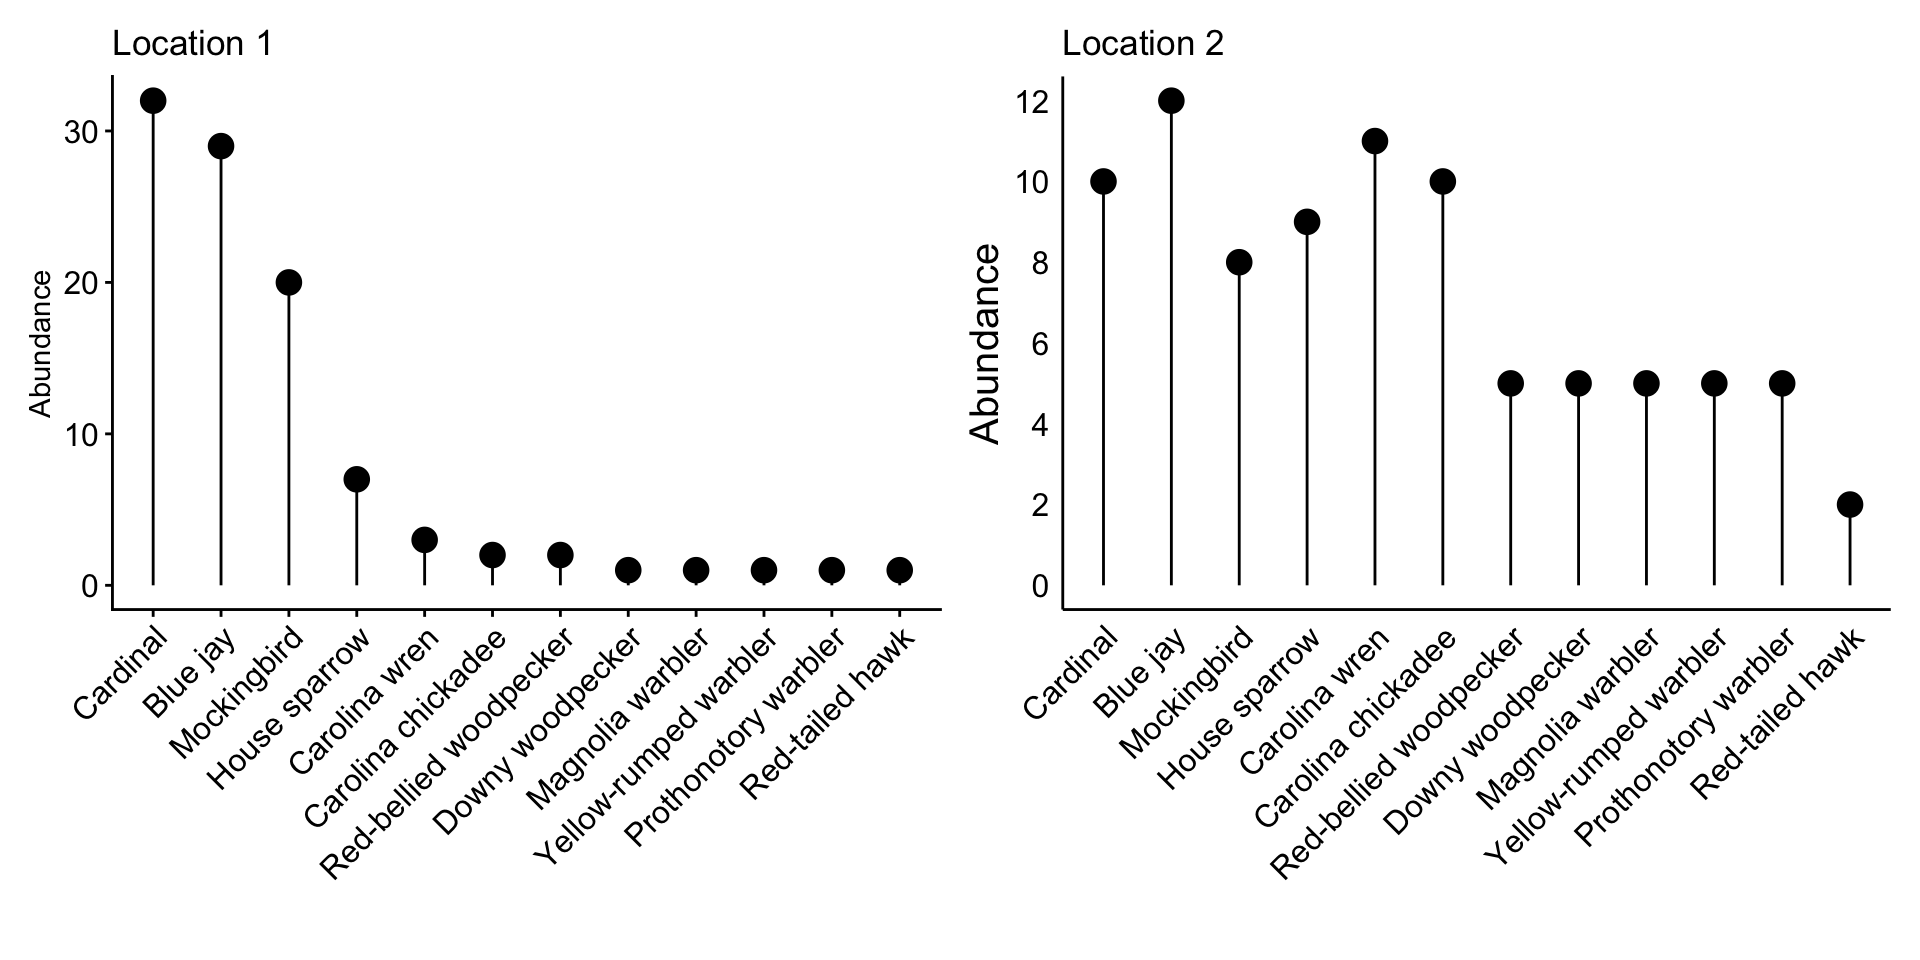
  • How about in Location 2?

Shannon diversity index
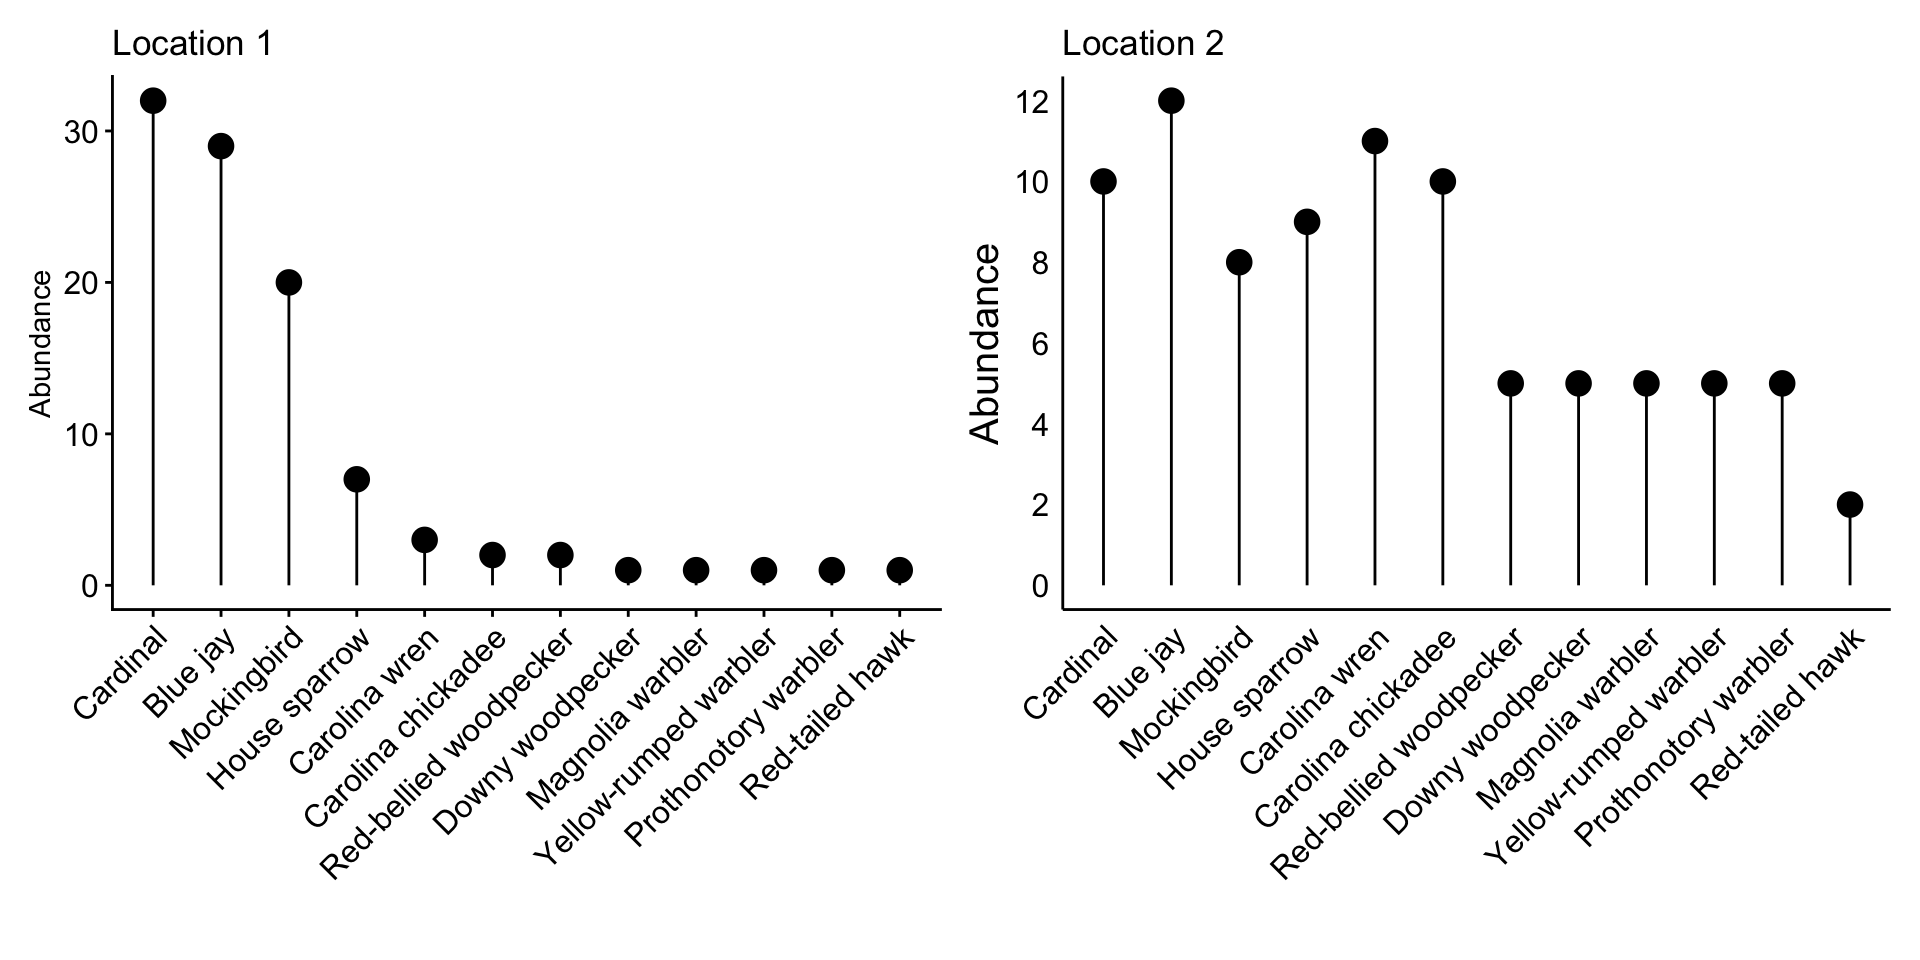
  • Location 1 is more “predictable”
  • Higher degree of “surprise” in Location 2
  • This is also called “Information entropy”
  • Commonly used across science, e.g. in computers, to optimize information storage and transfer

Shannon diversity index

A quantitative measure of biodiversity and community “evenness”

\[\overbrace{H'}^{\substack{\text{Shannon}\\{\text{index}}}} = -\sum_{i = 1}^{n} \overbrace{p_i}^{\substack{\text{proportional}\\ \text{abundance}}}*\overbrace{\text{ ln}(p_i)}^{\log\big(\substack{\text{proportional}\\ \text{abundance}}\big)}\]
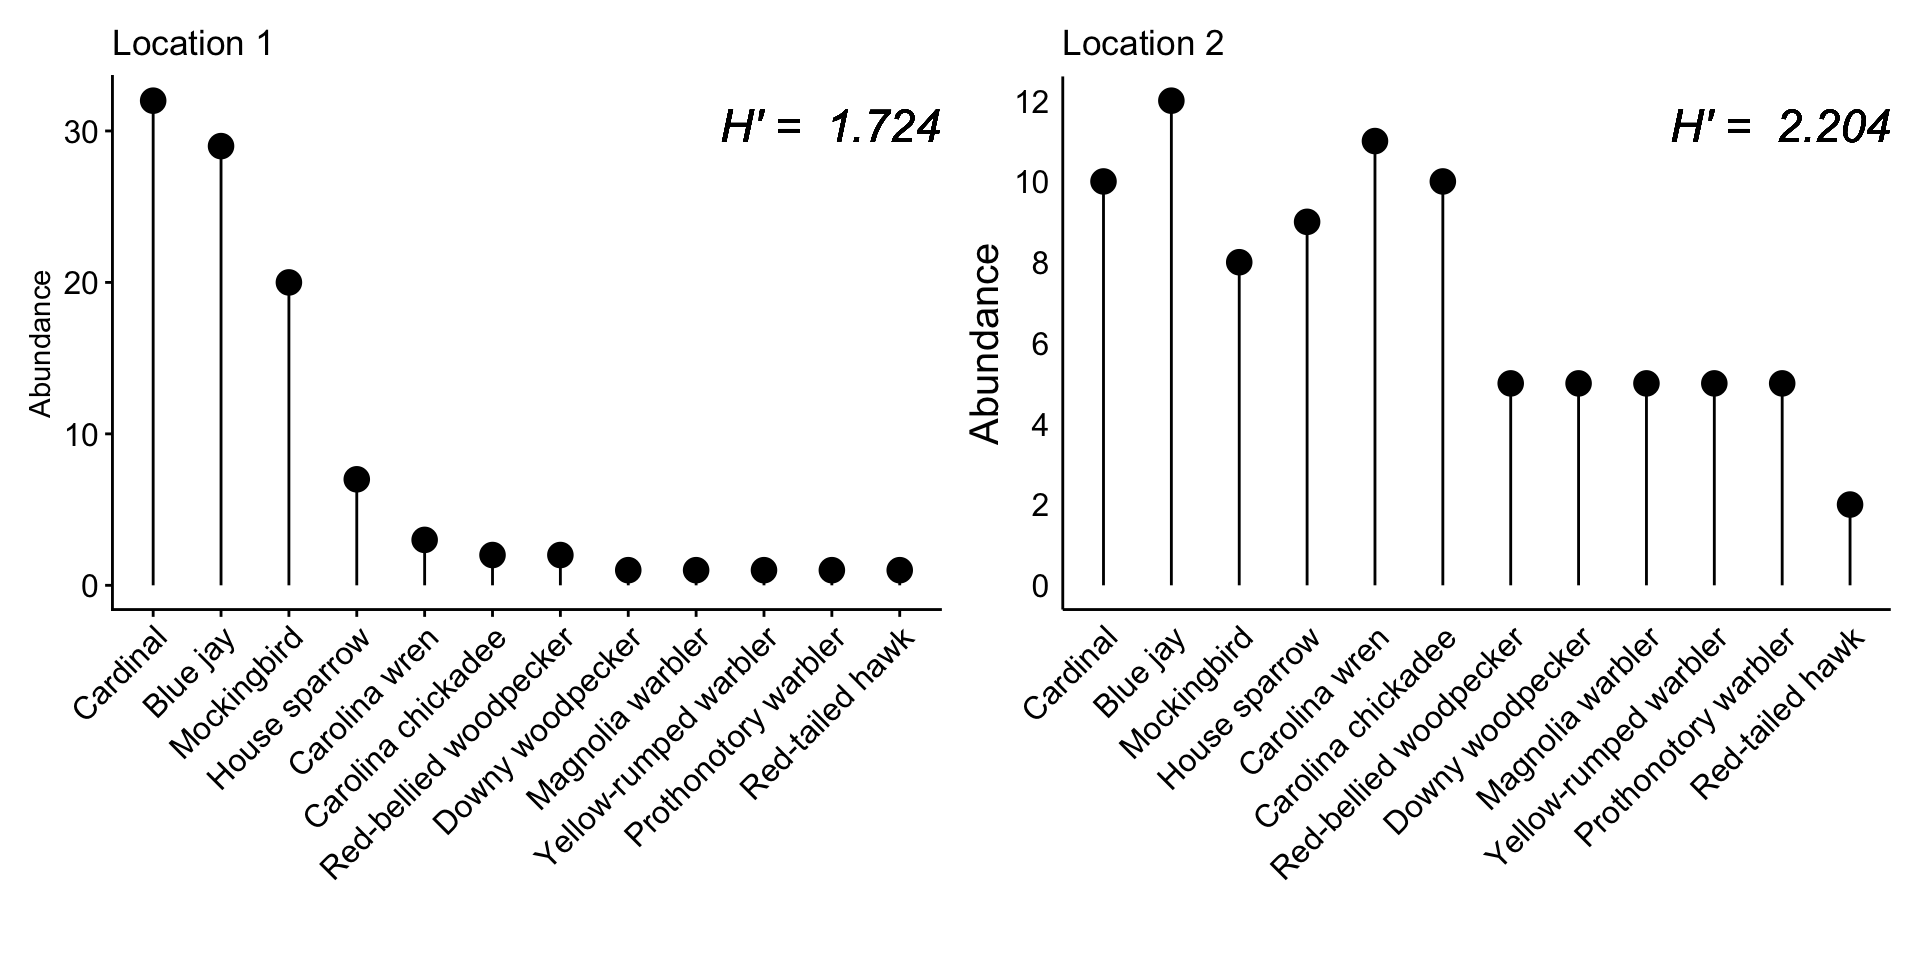
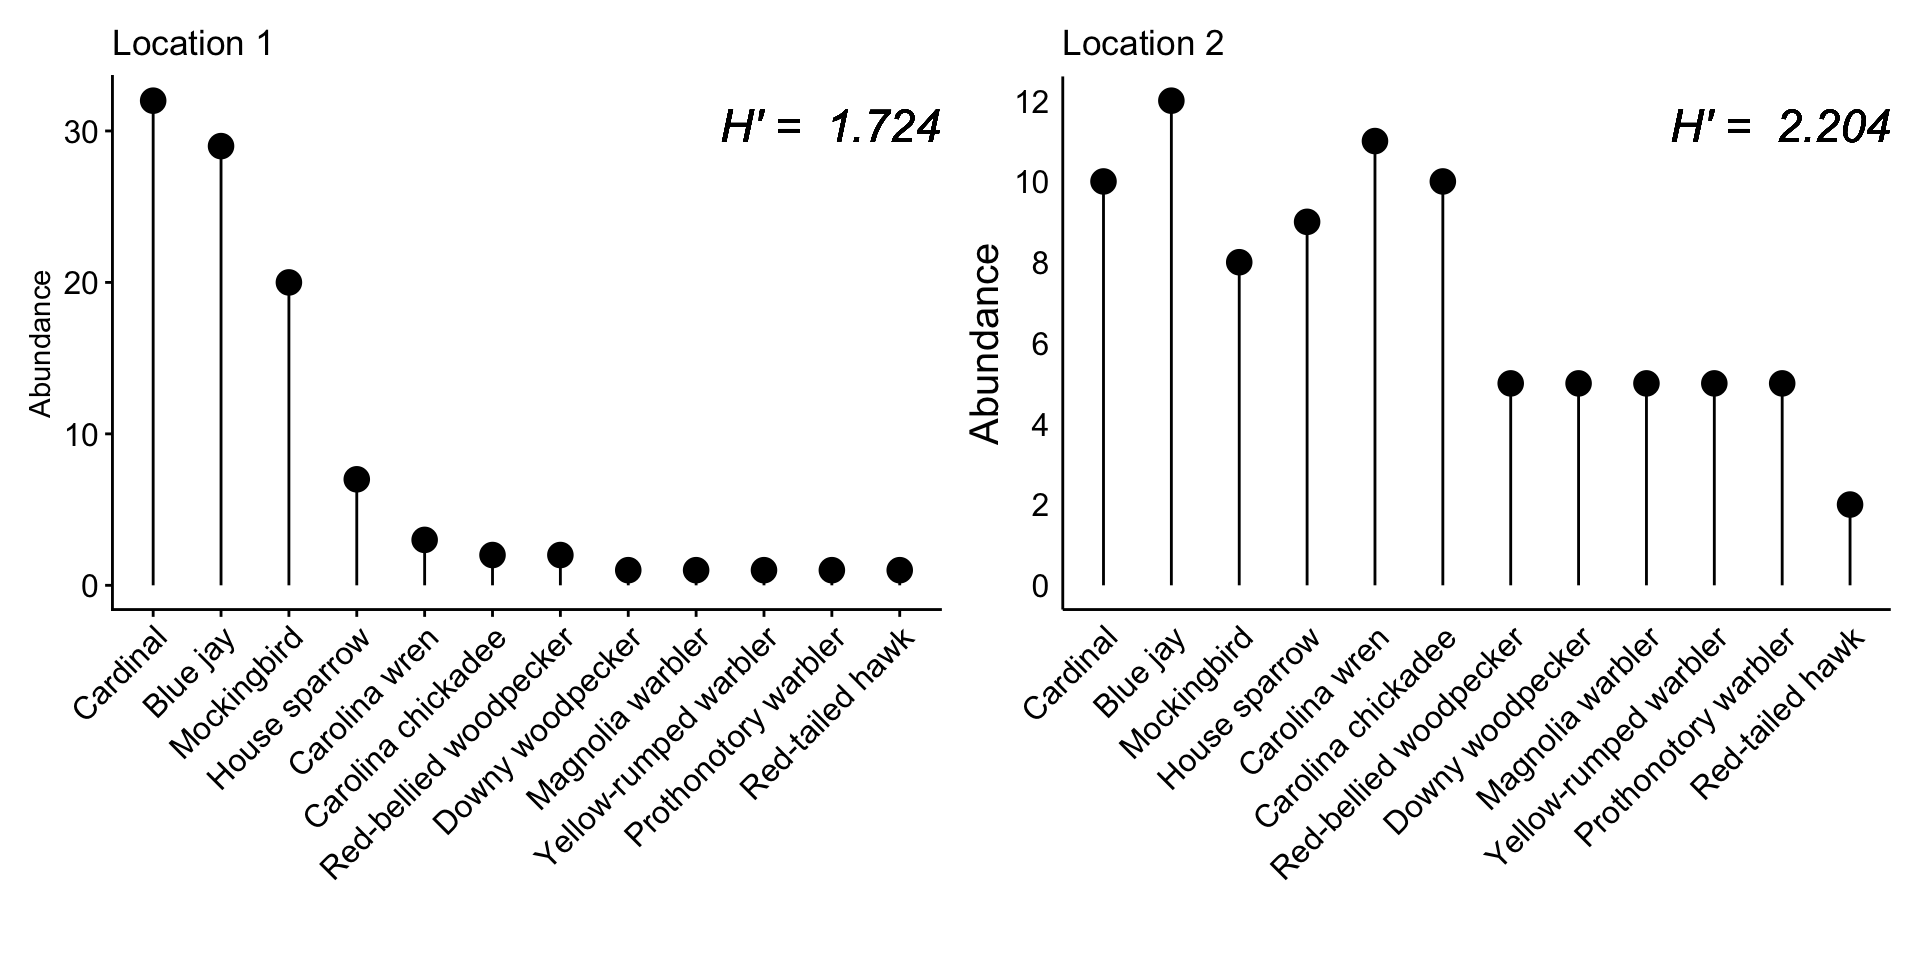
Calculating Shannon diversity

species Abundance proportion log(proportion) contribution
Cardinal 32
Blue jay 29
Mockingbird 20
House sparrow 7
Carolina wren 3
Carolina chickadee 2
Red-bellied woodpecker 2
Downy woodpecker 1
Magnolia warbler 1
Yellow-rumped warbler 1
Prothonotory warbler 1
Red-tailed hawk 1

Calculating Shannon diversity

species Abundance proportion log(proportion) contribution
Cardinal 32 0.32
Blue jay 29 0.29
Mockingbird 20 0.20
House sparrow 7 0.07
Carolina wren 3 0.03
Carolina chickadee 2 0.02
Red-bellied woodpecker 2 0.02
Downy woodpecker 1 0.01
Magnolia warbler 1 0.01
Yellow-rumped warbler 1 0.01
Prothonotory warbler 1 0.01
Red-tailed hawk 1 0.01

Calculating Shannon diversity

species Abundance proportion log(proportion) contribution
Cardinal 32 0.32 -1.139
Blue jay 29 0.29 -1.238
Mockingbird 20 0.20 -1.609
House sparrow 7 0.07 -2.659
Carolina wren 3 0.03 -3.507
Carolina chickadee 2 0.02 -3.912
Red-bellied woodpecker 2 0.02 -3.912
Downy woodpecker 1 0.01 -4.605
Magnolia warbler 1 0.01 -4.605
Yellow-rumped warbler 1 0.01 -4.605
Prothonotory warbler 1 0.01 -4.605
Red-tailed hawk 1 0.01 -4.605

Calculating Shannon diversity

species Abundance proportion log(proportion) contribution
Cardinal 32 0.32 -1.139 -0.364
Blue jay 29 0.29 -1.238 -0.359
Mockingbird 20 0.20 -1.609 -0.322
House sparrow 7 0.07 -2.659 -0.186
Carolina wren 3 0.03 -3.507 -0.105
Carolina chickadee 2 0.02 -3.912 -0.078
Red-bellied woodpecker 2 0.02 -3.912 -0.078
Downy woodpecker 1 0.01 -4.605 -0.046
Magnolia warbler 1 0.01 -4.605 -0.046
Yellow-rumped warbler 1 0.01 -4.605 -0.046
Prothonotory warbler 1 0.01 -4.605 -0.046
Red-tailed hawk 1 0.01 -4.605 -0.046

Biodiversity also changes over time and space
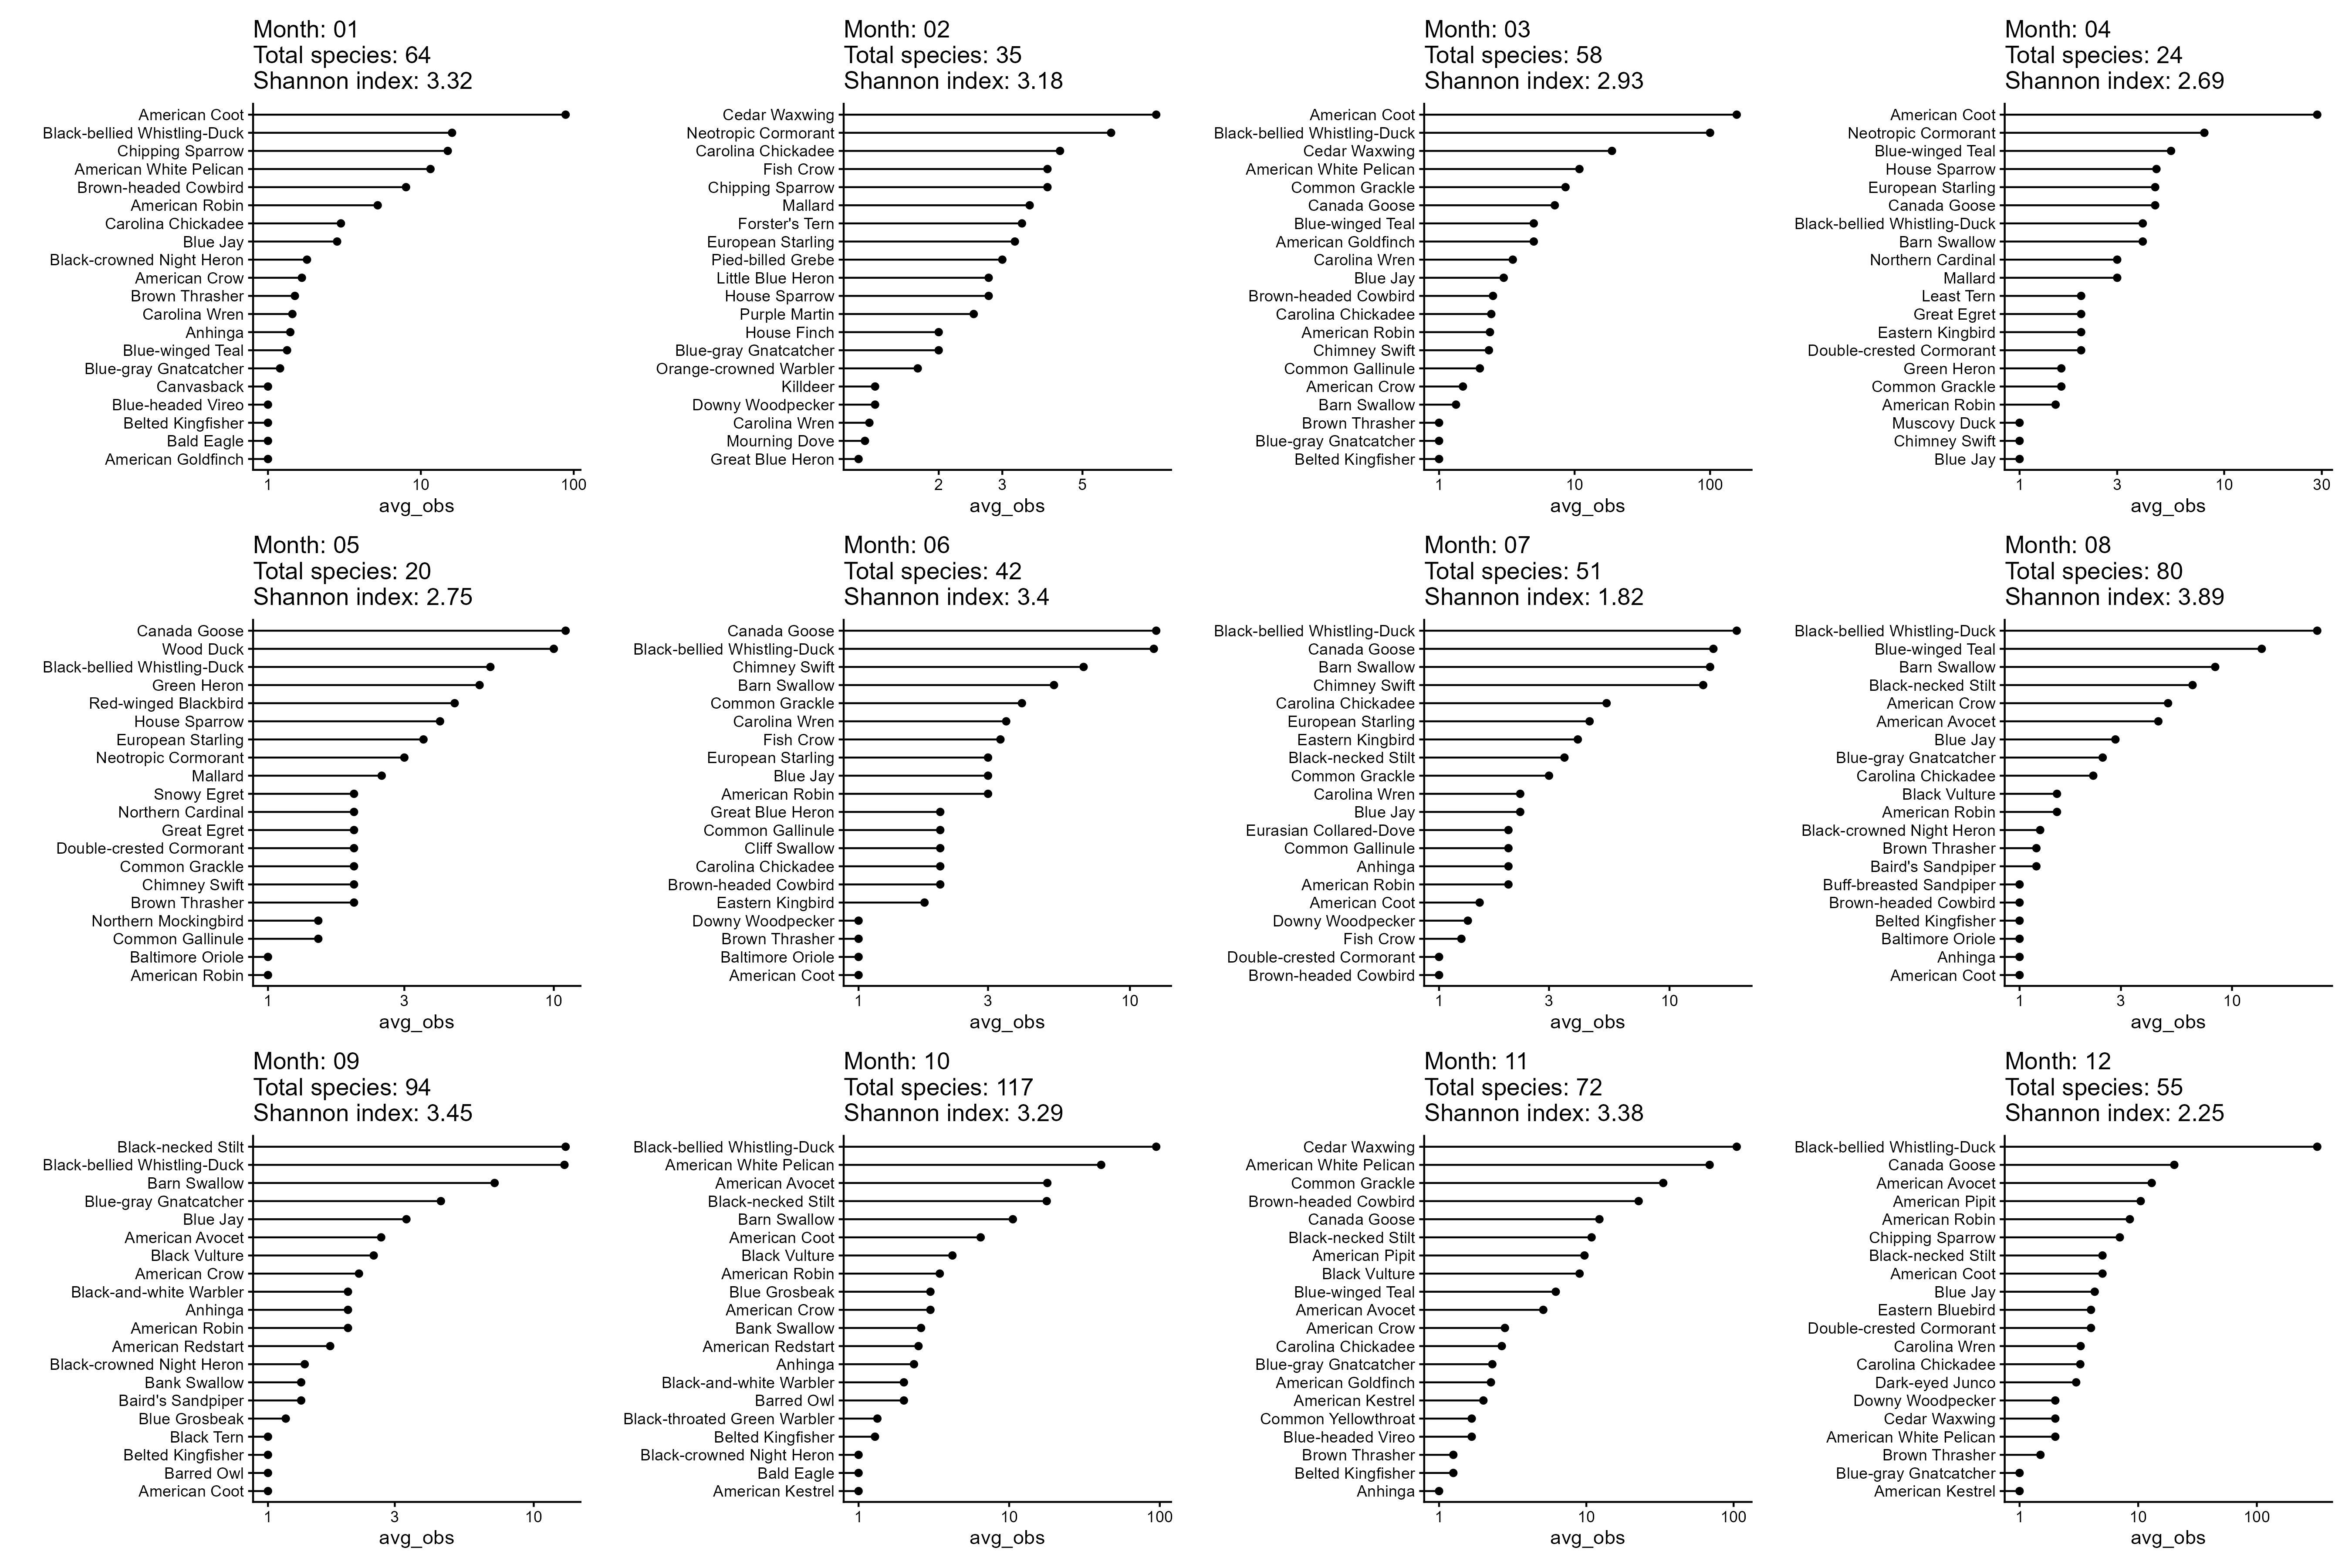
Consider two communities at two time points:

Community 1

  • January: Red tailed hawk, protonothary warbler, hairy woodpecker, blue jay
  • June: Red tailed hawk, protonothary warbler, hairy woodpecker, blue jay

Community 2

  • January: Red tailed hawk, protonothary warbler, hairy woodpecker, blue jay
  • June: Mississippi kite, Carolina wren, Downy woodpecker, Yellow-rumped warbler
  • Each community has 4 species
  • Community 2 changes a lot from Jan to June; Community 1 stays the same

Different metrics of biodiversity

  • \(\alpha\) diversity: Simple measure of biodiversity at a single place at a single time
  • \(\beta\) diversity: A measure of how biodiversity changes over time or over space