Patterns of diversity across space and time
Island Biogeography
Can we make quantitative predictions of species richness on islands?
Assume that Immigration rate is a function of distance from mainland, and of current species richness
Assume that Extinction rate is a function of island size, and of current species richness
A few possible outcomes
Two islands of the same size, but different distances away
Two islands of the same distance away, but different sizes
Extended implications
- “Island-ification” of nature under human modification of natural landscapes
Given habitat fragmentation and land-use change, can we apply lessons from island biography to habitat conservation?
- “SLOSS” debate
- “Single large or several small”
- If we are developing an area, should management prioritize making a single large biodiversity reserve, or several small ones?
SLOSS debate
- Early hypothesis (Diamond 1976):
- Large reserves should hold more biodiversity
- A collection of small reserves would be characterized by higher extinction rates
- Subsequent thinking recognized the distinction between \(\alpha\) and \(\beta\) diversity
- A single large reserve may hold more species
- But if they cover more heterogeneous landscapes, a collection of small reserves may encompass more species
![]()
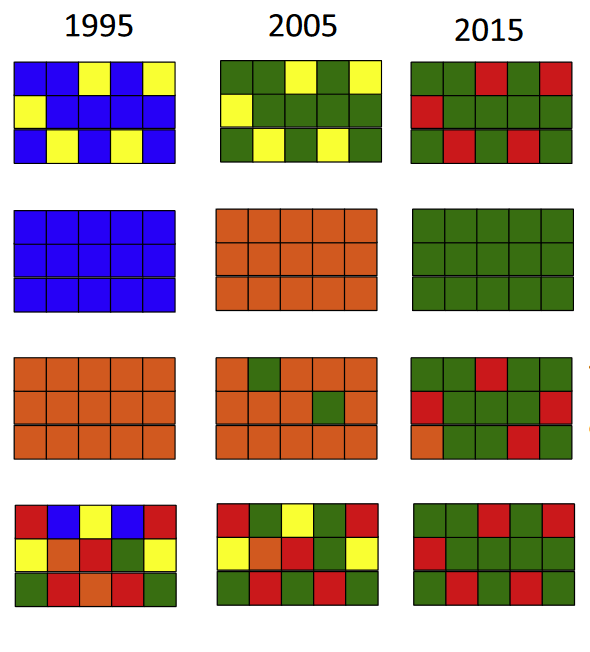
- How much total biodiversity is conserved under “Several small” is determined by the \(\beta\) diversity
![]() - If it is the same 15 species everywhere, then obviously Single Large is better! - But what if one reserve holds 15 species, and another reserve holds 15 different species? - In this case, if each of the 9 small reserves holds a distinct community of 15 species, total \(\gamma\) diversity is higher! - Reality will be somewhere in between: we need empirical data
- If it is the same 15 species everywhere, then obviously Single Large is better! - But what if one reserve holds 15 species, and another reserve holds 15 different species? - In this case, if each of the 9 small reserves holds a distinct community of 15 species, total \(\gamma\) diversity is higher! - Reality will be somewhere in between: we need empirical data
SLOSS debate
- Original assumption is that reserve size is directly related to extinction rates
- But what if the relationship isn’t quite simple?
- e.g. some organisms need more space than others!
SLOSS debate
- Original emphasis was on reserve size
- Larger reserve \(\to\) lower extinction rates
- But what determines immigration rates?
- How close is the nearest “mainland”
- But organisms can also move from island-to-island (reserve-to-reserve)
Reading for Friday
Thanks to technological advances, we are now able to study biodiversity patterns of bacteria and fungi like never before
In class on Friday, we will discuss a 2020 paper by Shao-peng Li et al., regarding soil microbial diversity in islands in a large reservoir lake in China
https://academic.oup.com/ismej/article/14/7/1886/7474932#435473733
Global trends in biodiversity
Review of Biodiversity Patterns and Landscape Ecology
Two weeks ago, we introduced the ideas of \(\alpha\), \(\beta\), and \(\gamma\) diversity
\(\alpha\) diversity: Diversity at the smallest spatial scale
\(\gamma\) diversity: Diversity at the largest spatial scale
\(\beta\) diversity: Turnover in diversity
Trends in biodiversity
- We also introduced the idea of global patterns in biodiversity
Ecologists now know that global environmental change is affecting biodiversity and species richness across the world
- Reduction in habitat
- Land use change
- Changes to environmental conditions (pollution, drought, warming, etc.)
The question that we will explore today is
What does ecological research tell us about the nature of biodiversity loss?
- In other ways, how does biodiversity loss work? How is it measured? Where is it happening?
Put another way,
At a global scale, decrease in \(\gamma\) diversity over time is a well-established pattern
What are the patterns at local scales?
![]()
Globally, species extinction rates have increased relative to the background rate found in the fossil record by tenfold to 1000-fold
“However, if we examine the literature on empirically documented trends in biodiversity, a complex picture emerges with many contradictory results”
Biodiversity trends at local scales
Say we are interested in diversity of birds on an island over time.
![]()
What is the trend in \(\alpha\) diversity over time?
But, is biodiversity changing through time?
\(\beta\) diversity over time?
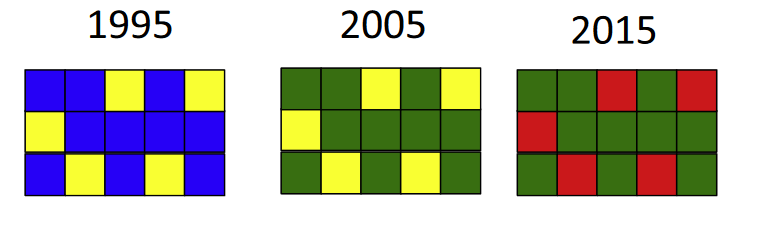
Biodiversity trends at local scales
Say we are interested in diversity of birds on a different island over time.
Say we are studying bird diversity on multiple islands over time.
![]()
What is the trend in \(\alpha\) diversity of each island?
What is the trend in \(\gamma\) diversity?
Is there an overall loss of biodiversity?
Biodiversity trends at local scales
- Answering questions about biodiversity dynamics on Earth is hard!
- We need data from lots of places across the world
- We need data over long spans of time
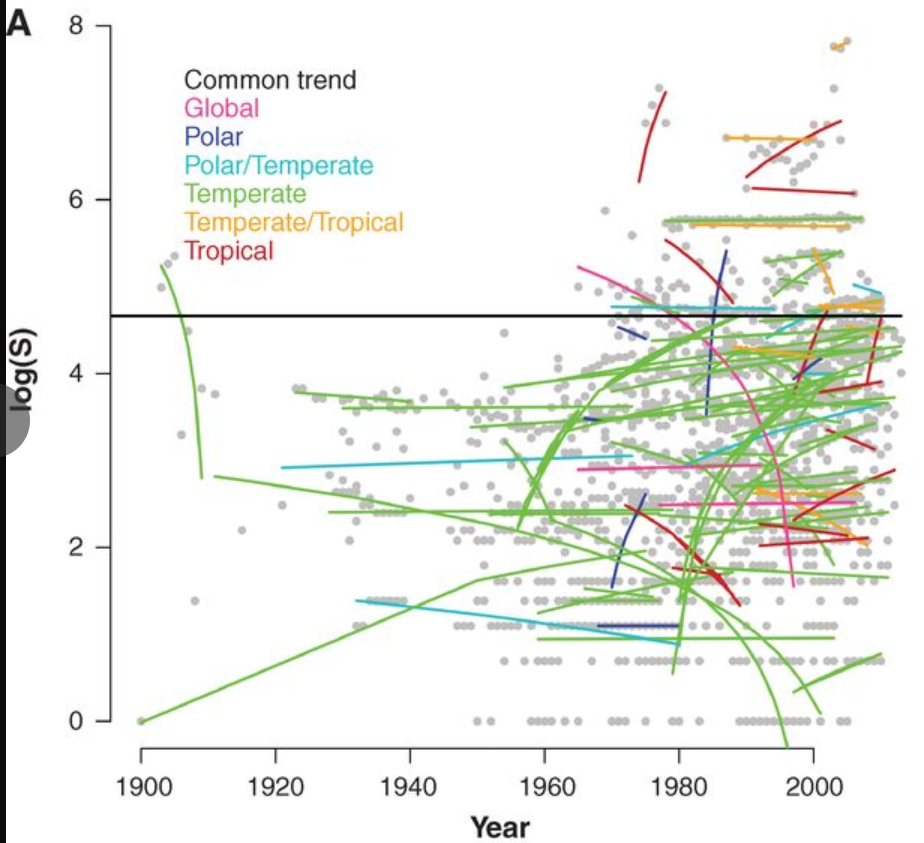
Individual sites vary in their \(\alpha\) diversity trends through time
What does this mean?
- Globally, species loss is happening - there is no doubt of that.
- But, if we look at the same place over and over again through time, we are not seeing consistent declines in diversity
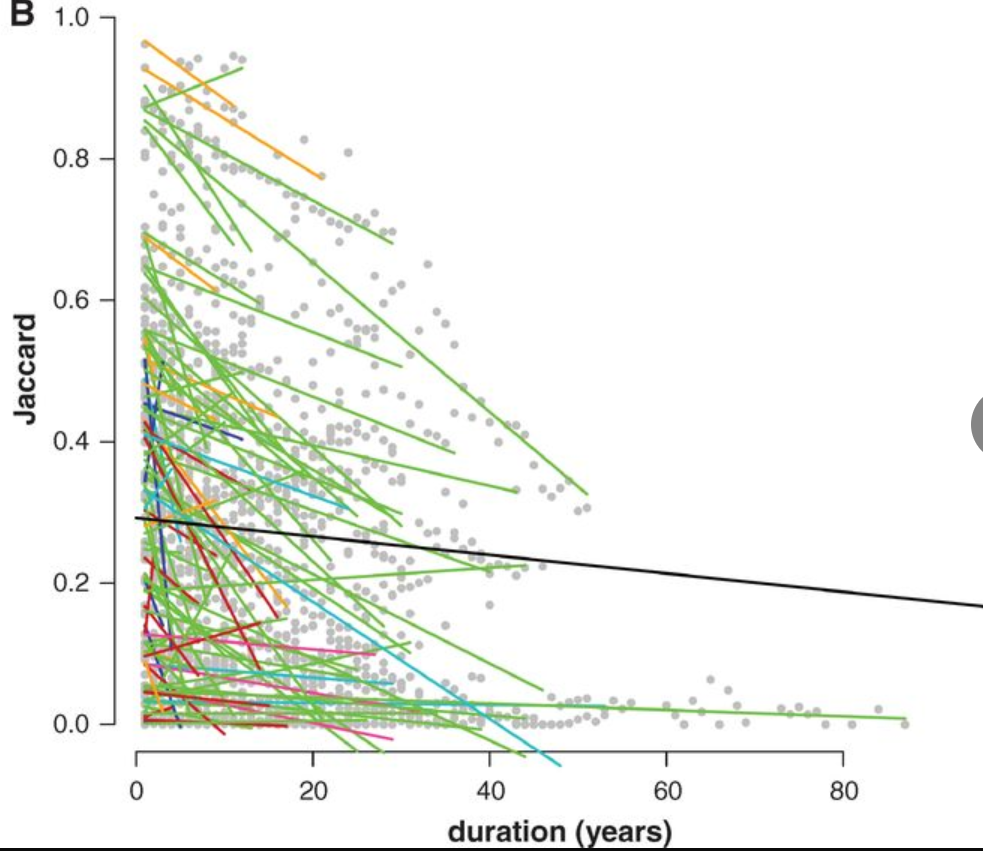
But within sites, substantial temporal \(\beta\) diversity
On the following graph, the Y-axis tells us about the \(\beta\) diversity over time for each location
Higher number on the Y-axis mean that similar species were found over time, lower numbers mean that there was more change in species composition
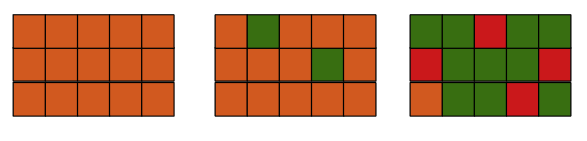
Instead, what we are seeing is a change in species
What does this mean?
- Decline in \(\gamma\) diversity, but not necessarily a decrease in \(\alpha\) diversity everywhere
![]()
- This means that as species extinctions happen, other species are “winning out”
Where does this leave us with the global extinction crisis?
Discussion
The main argument of McGill et al. is that ecologists should not pretend that biodiversity crisis is easy to explain
We need to be nuanced in data collection, careful in analysis, and transparent in communication – even when the message is complicated
This path will lead to honest public awareness and better policies.
Discussion of
Island biogeography of soil bacteria and fungi: similar patterns, but different mechanisms
We thought we understand the world…
…But we are still discovering new patterns!
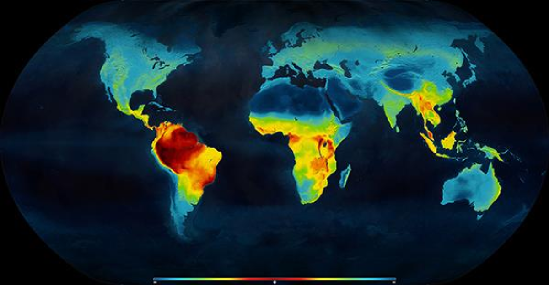
Latitudinal diversity gradient
![]()
Latitudinal diversity gradient
![]()
Diversity of amphibian species, from Anton-Pardo, 2019
Latitudinal diversity gradient
. . . ![]()
Diversity of mammal species, from Davies et al. 2008
Latitudinal diversity gradient
![]()
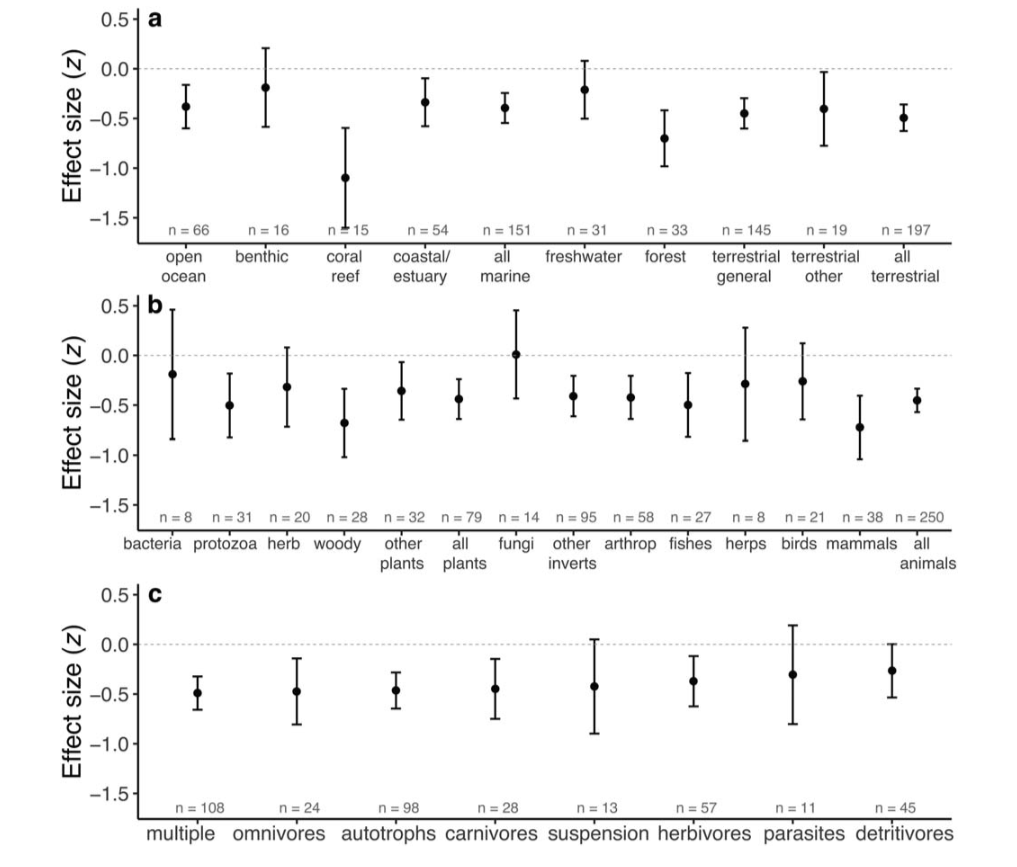
But some groups seem to defy this
For a long time, these patterns were invisible
Ecologists had no way of studying microbial communities!
But now we do, and our ability is improving every day
Paper discussion instructions
- Split into 5 groups of 3-4, designate a timekeeper, facilitator, and reporter
- At least one person in each group should have a digital copy of the paper
- Discuss for 20 minutes